
Cost Analysis
Cost Analysis:
The Complete 2026 Guide
Every method, every framework, and the real-world cases that actually matter — from classic break-even to AI-assisted total cost of ownership. Everything you need to stop guessing and start deciding.
What Cost Analysis Actually Is
There’s a version of this topic that’s been explained a thousand times, and then there’s reality. Let’s start with the latter.
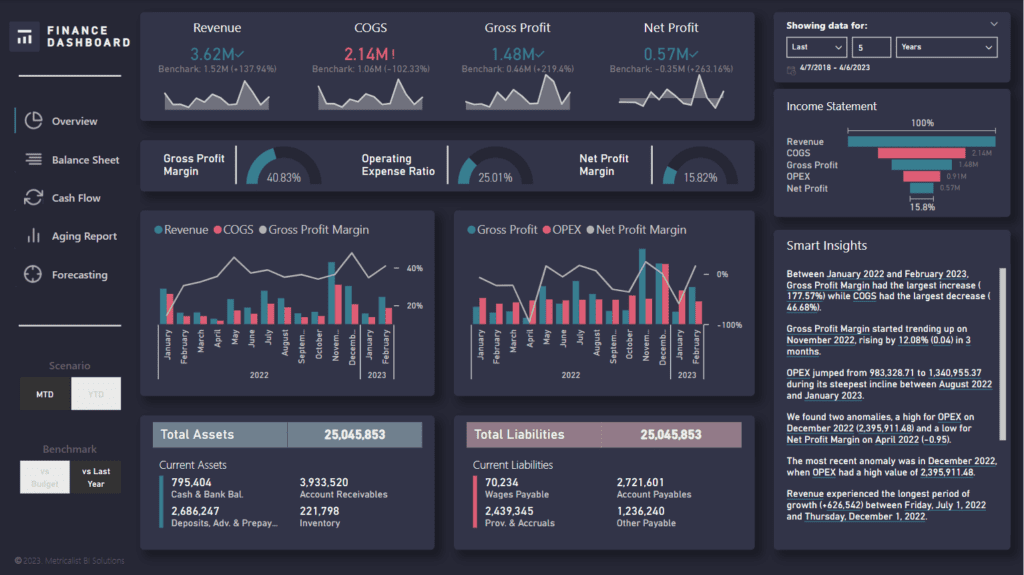
Cost analysis is the systematic process of identifying, categorizing, measuring, and evaluating every expense tied to a decision, project, or operation — with the goal of understanding financial impact clearly enough to act on it. That sounds obvious. The uncomfortable truth is that most businesses don’t actually do it properly. They approximate. They guess. They confuse cost with price, or they count direct expenses while ignoring the indirect ones that quietly erode margins for years.
Done well, cost analysis answers three questions at once: What are we actually spending? Where is value being created or destroyed? Which path forward is financially sound? It’s less a spreadsheet exercise than a habit of rigorous financial thinking.
The scope of cost analysis is deliberately broad. It applies equally to a startup evaluating its first hire, a manufacturer deciding whether to automate a production line, a healthcare network comparing two surgical protocols, or a government agency assessing infrastructure investment. The methods differ — and we’ll cover all of them — but the underlying discipline is the same.
“Cost analysis doesn’t tell you what to do. It removes the comfortable fictions that let you avoid deciding.”
One critical distinction worth making immediately: cost analysis is not the same as cost accounting. Cost accounting records what happened. Cost analysis uses that record — along with projections, scenarios, and comparisons — to inform what should happen. They’re related but the direction of inquiry is different.
Why It’s More Urgent in 2026
Economic pressure hasn’t disappeared — it’s just wearing different clothes. After a period of near-zero interest rates that made capital feel cheap, businesses are now navigating a tighter credit environment, persistent inflationary pressure on labor and materials, and rapid technology disruption that constantly reshuffles competitive costs. The margin for financial imprecision is thinner than it was three years ago.
Look at those numbers carefully. The companies achieving 200–400% ROI from AI aren’t smarter — they’re more rigorous about costs. Visionary AI adopters show 1.7x revenue growth and 3.6x three-year total shareholder return versus laggards, and the gap is largely explained by their willingness to do the financial work upfront rather than flying on optimism.
Meanwhile, more than half of finance executives cannot clearly demonstrate ROI from their AI and GenAI initiatives. That’s not a technology problem. That’s a cost analysis problem.
Inflation adds another layer. When material costs fluctuate by double digits within a year, fixed-cost assumptions collapse. Life cycle cost analysis, scenario planning, and variance monitoring aren’t academic exercises anymore — they’re operational necessities. The companies that build cost analysis into their decision-making culture simply make fewer catastrophic bets.
The Eight Core Methods — and When to Use Each
No single method works for every situation. A good financial team typically reaches for several simultaneously, cross-checking conclusions. Here’s an honest breakdown of what each does, what it’s good at, and where it falls short.
Cost-Benefit Analysis (CBA)
Compares total expected costs against total expected benefits, usually expressed as NPV, BCR, or IRR. The workhorse of project evaluation.
Break-Even Analysis
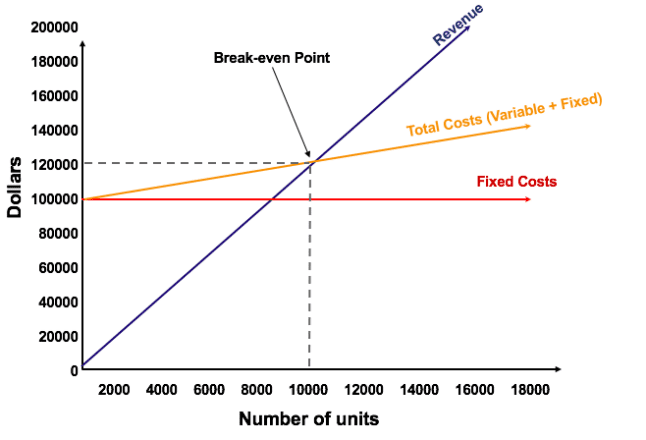
Identifies the production or sales volume at which total revenues equal total costs. Deceptively simple — and frequently misused.
Activity-Based Costing (ABC)
Allocates overhead by actual resource consumption rather than volume. More accurate, more complex, and increasingly enabled by software.
Marginal Cost Analysis
Examines the cost of producing one additional unit. Essential for optimizing output levels and understanding economies of scale.
Life Cycle Cost Analysis (LCCA)
Totals all costs over an asset’s complete life — acquisition, operation, maintenance, disposal. Often reveals that the cheapest purchase is the most expensive decision.
Opportunity Cost Analysis
Quantifies the value of the next best alternative foregone. Rarely captured in accounting systems, but always present in every decision.
Variance Analysis
Compares actual financial outcomes against budgeted or projected figures to isolate the source of deviations.
Differential Cost Analysis
Focuses only on costs that differ between two alternatives — filtering out costs that won’t change regardless of the decision taken.
| Method | Core Question | Key Output | Complexity | Industries |
|---|---|---|---|---|
| Cost-Benefit (CBA) | Are benefits worth the costs? | BCR, NPV, IRR | Medium | All / Government |
| Break-Even | At what volume do we profit? | Break-even units / revenue | Low | Retail / Manufacturing |
| Activity-Based (ABC) | Which activities consume resources? | Cost per activity | High | Manufacturing / Services |
| Marginal Cost | What does the next unit cost? | MC curve, optimal volume | Medium | Agriculture / Production |
| Life Cycle (LCCA) | What’s the true total cost over time? | Total ownership cost | High | Energy / Infrastructure |
| Opportunity Cost | What are we giving up? | Forgone value estimate | Medium | Strategy / Services |
| Variance Analysis | Where did we deviate from plan? | Variance reports | Low–Med | All industries |
| Differential | Which option costs less? | Cost difference between options | Low | Operations / Finance |
In practice, rigorous decisions use at least two methods cross-checking each other. CBA plus break-even analysis is a classic pairing for new product launches — the first tells you if the project is worth it at all, the second tells you how much you have to sell before it stops bleeding cash.
Direct, Indirect & Hidden Costs — The Full Cost Landscape
One of the most consistent findings across cost analysis failures is the same: businesses count direct costs and pretend the rest doesn’t exist. Let’s fix that.
Direct Costs
These are the obvious ones — costs that can be traced unambiguously to a specific product, project, or service. Raw materials, direct labor, specific machinery time. They’re easy to identify, which is exactly why they’re overemphasized.
Indirect Costs
Shared costs that support multiple activities simultaneously: rent, utilities, management salaries, IT infrastructure, HR functions. Focusing solely on direct costs while disregarding indirect costs results in an incomplete assessment of overall expenses — indirect costs, including overhead and administrative expenses, wield substantial influence on profitability and financial viability.
Activity-based costing exists specifically to handle this problem, assigning indirect costs to activities based on actual consumption rather than arbitrary allocation percentages.
Hidden Costs — The Real Drain
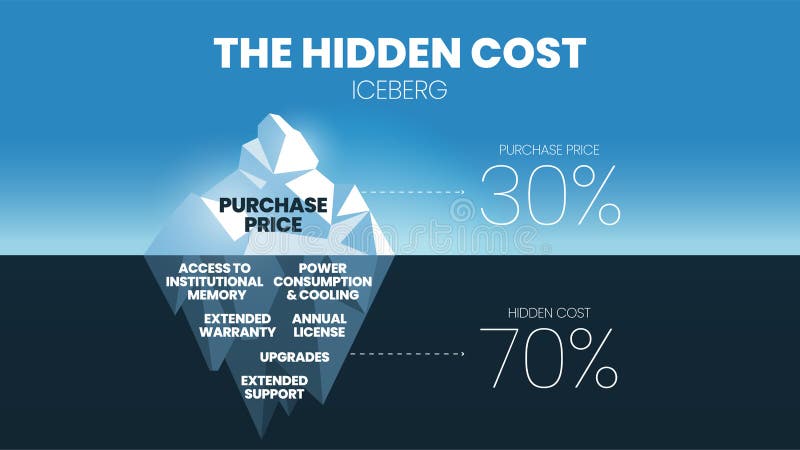
This is where most analyses go wrong. Hidden overhead costs can sabotage small business budgets if not managed — these may include insurance premiums which often rise yearly, usage-based fees from cloud services and software subscriptions that add up quickly when usage limits are exceeded, and warehouse or storage inefficiencies that quietly drain resources.
Hidden costs fall into several categories that merit their own mental model:
| Hidden Cost Category | Common Examples | Why It’s Missed | Mitigation |
|---|---|---|---|
| Compliance & Legal | GDPR fines, audit costs, contract review | Infrequent, unpredictable timing | Legal budget reserve; compliance calendar |
| Turnover & Recruitment | Lost productivity, hiring fees, onboarding time | Not on P&L as a line item | Retention tracking, total cost-per-hire model |
| Technical Debt | Legacy system maintenance, integration failures | Deferred rather than expensed | Architecture review; TCO modeling |
| Subscription Creep | Unused SaaS licenses, auto-renewals | Distributed purchasing authority | Quarterly SaaS audits |
| Opportunity Cost | Foregone revenue from wrong priorities | Doesn’t appear in any ledger | Strategic alternative analysis |
| Error Correction | Rework, payroll corrections, data fixes | Buried in labor costs | Error rate tracking; process audits |
PwC UK found the cost of payroll errors for the average FTSE 100 company runs between £10 million and £30 million per year. These aren’t exotic costs — they’re routine administrative failures that never get surfaced because no one is doing the analysis. Smaller businesses face the same proportional exposure.
Intangible Costs
Brand damage, employee morale erosion, customer trust lost after a failure, regulatory relationships strained by a compliance incident. Intangible doesn’t mean unimportant — it means harder to quantify. The best analysts acknowledge intangibles explicitly, even when they can’t assign a precise dollar figure.
How to Run a Cost Analysis: Step by Step
The process below applies to virtually any analysis — a capital investment, a process change, a build-vs-buy decision, or a full operational review. Adjust the depth to the stakes involved. A $5,000 software subscription doesn’t need the same rigor as a $5 million facility investment, but both deserve the same structure.
-
Define the Scope and Decision Clearly
Before touching any numbers, write one precise sentence that describes what decision this analysis will inform. Vague scope produces vague analysis. “Should we automate our invoicing process?” is better than “Should we invest in technology?”
-
Establish a Time Horizon
Are you analyzing a one-time cost, a 12-month operational budget, or a 10-year asset investment? The time horizon determines which methods apply and how future costs should be discounted.
-
Identify All Cost Categories — Including the Uncomfortable Ones
Build a comprehensive cost breakdown structure. Direct costs, indirect costs, one-time setup costs, recurring operational costs, compliance costs, training and change management, and opportunity costs. Many estimators focus heavily on direct costs like labor and materials while neglecting indirect costs such as project management, overhead, and training. Don’t make that mistake.
-
Collect Cost Data from Reliable Sources
Finance records, vendor quotes, benchmark data from industry studies, and historical project data from comparable initiatives. Cross-check vendor estimates against independent benchmarks wherever possible.
-
Quantify Benefits (for CBA) or Define Comparison Alternatives
Assign monetary values to expected benefits — cost savings, revenue uplift, risk reduction, efficiency gains. For alternatives analysis, define each option’s full cost profile using the same categories and time horizon.
-
Apply the Appropriate Method(s)
Use the method table in Section 03 to select the right tools. For most significant business decisions, CBA plus at least one secondary method (break-even, TCO, or differential analysis) produces more reliable conclusions.
-
Run Sensitivity Analysis
Identify your two or three most consequential assumptions — volume, unit cost, timeline — and test how the conclusion changes when those assumptions shift by ±20%. If a small change completely reverses the recommendation, you have a fragile analysis. That’s information worth having before committing resources.
-
Present Findings and Make a Recommendation
The output of a cost analysis should be a decision, not a data dump. Present the key finding, the confidence level, the dominant assumptions, and a clear recommendation. Leadership can always ask for more detail — but they should get clarity first.
NPV = Σ [ (Benefit_t − Cost_t) ÷ (1 + r)^t ] for t = 0 to n
Where: r = discount rate, t = time period, n = analysis horizon
BCR > 1.0 = project creates value | BCR < 1.0 = project destroys value
Break-Even Revenue = Fixed Costs ÷ Contribution Margin Ratio
Contribution Margin Ratio = (Revenue − Variable Costs) ÷ Revenue
Advanced Frameworks for Complex Decisions
Total Cost of Ownership (TCO)
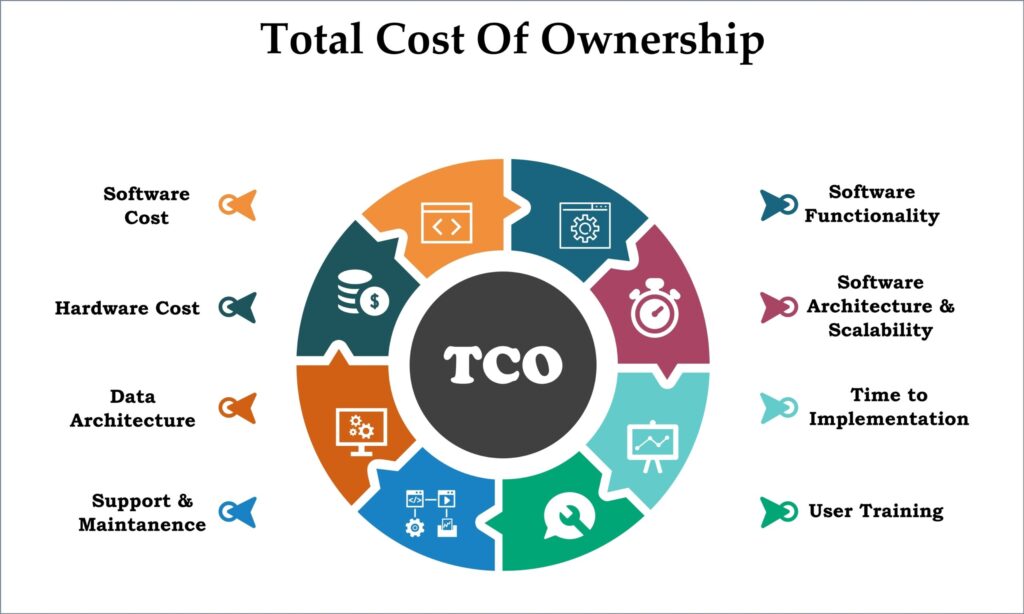
TCO is life cycle costing applied specifically to technology, equipment, and systems. It became standard practice in IT procurement and has expanded to AI deployments, infrastructure, and fleet management. The formula is deceptively simple:
For AI systems, add: Data preparation cost + Governance & compliance cost + Retraining cost over useful life
The discovery phase of AI projects alone, often accounting for 10 to 15 percent of total cost, includes feasibility assessments, data quality evaluation, and initial strategy design — enterprises underestimate this stage at their peril, as poor preparation can lead to costly missteps later on.
Four-Pillar ROI Framework for AI & Technology Investments
As technology investments have grown more complex, simple CBA has been supplemented by structured multi-pillar frameworks. The most effective approach uses four key areas: efficiency gains, revenue generation, risk mitigation, and business agility.
| Pillar | What to Measure | Metrics |
|---|---|---|
| Efficiency Gains | Labor savings, process acceleration, error reduction | Hours saved/month, error rate, cycle time |
| Revenue Generation | New revenue enabled, faster time-to-market | Revenue uplift, deal velocity, conversion rate |
| Risk Mitigation | Compliance risk reduced, downtime prevented | Incident frequency, compliance cost avoidance |
| Business Agility | Decision speed, adaptation capability | Time-to-insight, scenario response time |
Activity-Based Costing in Practice
ABC is the right answer when traditional volume-based overhead allocation is distorting your view of profitability. The process involves: identifying all significant activities in the business, assigning resource costs to each activity, and then assigning activity costs to products or services based on actual consumption.
A manufacturer running three product lines discovers under standard costing that Product C appears profitable. ABC reveals that Product C requires disproportionate customer service time, special packaging, and shorter production runs — making it actually loss-making. That’s a decision-reversing insight that standard analysis would have missed entirely.
Quick rule of thumb: if you’re evaluating a one-time decision, use CBA. If you’re evaluating an asset or technology over time, use TCO/LCCA. If you’re analyzing ongoing operational profitability, use ABC. If you’re deciding between two specific alternatives, use differential cost analysis with sensitivity testing.
Real-World Case Studies
Abstract frameworks only go so far. Here are concrete cases — drawn from documented outcomes — that show what proper cost analysis looks like in practice, and what it can prevent or unlock.
CirrusMD: AI Workflow Automation in Virtual Care
CirrusMD, serving over 13 million members, faced mounting costs in benefits navigation and clinical documentation. Before committing to AI automation, the company ran a structured TCO analysis covering implementation, integration with existing EHR systems, clinical validation requirements, and HIPAA compliance overhead.
The analysis revealed that the compliance and governance costs — typically underestimated by 30–40% in healthcare AI deployments — were manageable given the scale of the documentation burden. With that visibility, the project received executive approval. The AI system now automatically reviews patient chat history, provides personalized health benefit recommendations covered by the patient’s plan, and generates complete SOAP notes for physician review, all while maintaining regulatory compliance.
Klarna: The $40M CBA Behind an AI Chatbot
When Klarna evaluated replacing a portion of its customer service operation with AI, the cost-benefit analysis had to account for implementation cost, risk of customer dissatisfaction (a brand cost with long-tail financial implications), and the ongoing cost of monitoring and correction.
The analysis also modeled the differential cost between the AI path and maintaining human agents — examining what costs would exist in each scenario and which were genuinely comparative. The resulting system handles 2.3 million customer inquiries monthly, slashing resolution times by 80% and decreasing repeat inquiries by 25%, driving an estimated $40 million profit improvement in 2024.
The Sherlock Company: Life Cycle Thinking for Production Workflows
A video production company with high-volume content needs evaluated transitioning from manual thumbnail creation to an AI-powered pipeline. A superficial cost analysis might have looked only at the software licensing cost versus the labor cost of one thumbnail artist. A complete LCCA included training, workflow redesign, quality validation time, and the cost of creative misses — outputs that don’t meet client standards.
The full analysis justified the investment. Production time decreased from one day to 10 minutes, and the company established scalable content generation with unlimited variations at minimal added cost.
What These Cases Have in Common
Every successful case above involved a full cost picture — not just the obvious expenditure, but integration costs, compliance overhead, transition friction, and ongoing monitoring. In each case, the analysis changed how the project was scoped or implemented, not just whether it was approved. That’s what good cost analysis does. It doesn’t just validate a decision already made — it shapes how that decision gets executed.
The Five Costliest Mistakes in Cost Analysis
These aren’t theoretical. They come up in virtually every organization that hasn’t formalized its cost analysis practice. Some are embarrassingly common among well-resourced firms.
Mistake 1: Counting Only Direct Costs
Focusing solely on direct costs while disregarding indirect costs results in an incomplete assessment — indirect costs wield substantial influence on profitability and financial viability. The solution is a mandatory cost breakdown structure that forces every category to be explicitly addressed before analysis begins — even if the conclusion is “this category is immaterial.”
Mistake 2: Treating Hidden Costs as Non-Costs
Often there are hidden costs that companies fail to recognize without thorough analysis — whether expenses are one-time or recurring, controllable or non-controllable, fixed or variable are all important considerations. Build a formal hidden cost checklist and run it on every significant analysis. The 30-minute audit will save multiples of that time in cost surprises.
Mistake 3: Misreading Break-Even Relationships
Misinterpreting cost-volume-profit relationships can result in ill-advised choices regarding pricing strategies, production levels, and overall profitability. Misjudging the break-even point might lead to setting prices too low, jeopardizing profitability, or incorrectly estimating production levels, which affects resource allocation and operational efficiency.
Mistake 4: Single-Point Estimates Without Sensitivity Testing
A cost analysis that delivers one number is a false precision machine. Every significant assumption carries uncertainty. Sensitivity analysis should be non-negotiable on any decision involving meaningful capital or operational commitment. Model the upside, the base case, and the pessimistic scenario — and be honest about which inputs could realistically go wrong.
Mistake 5: Omitting Change Management and Training Costs
The cost of change management — including employee training, resistance mitigation, and communication efforts — often exceeds initial estimates. Technology deployments almost universally underestimate this. A system that sits unused because no one was properly trained is a system that delivered zero ROI on 100% of the cost.
Double counting — charging an expense both as a direct cost and within an indirect overhead pool — is a recognized error that can distort overhead rates and mislead decision-makers. Organizations with multiple cost pools need explicit policies and regular reconciliation to prevent this from compounding across multiple reporting periods.
Tools & Software for Cost Analysis in 2026
The tool landscape has changed substantially. Two years ago the typical cost analysis lived in a spreadsheet. That’s still true for many teams — and for well-structured decisions, a rigorous Excel model still outperforms an under-configured platform. But the category has genuinely expanded.
| Tool Category | Examples | Best For | Limitations |
|---|---|---|---|
| Spreadsheet Models | Excel, Google Sheets + custom templates | Flexibility, auditability, all company sizes | Error-prone at scale; version control issues |
| ERP / Accounting Platforms | SAP, Oracle NetSuite, Microsoft Dynamics | Large-scale variance analysis, ABC integration | High implementation cost; rigid structure |
| Dedicated Cost Management | CostPerform, Prophix, Planful | Activity-based costing, multi-department allocation | Mid-to-enterprise market; learning curve |
| FP&A Platforms | Workday Adaptive, Anaplan, Mosaic | Scenario modelling, sensitivity analysis at scale | Subscription cost; requires financial expertise to configure |
| AI-Assisted Analysis | Embedded AI in ERP tools; custom LLM workflows | Automating data collection, variance flagging, anomaly detection | Data quality dependencies; governance requirements |
A word on AI-assisted cost analysis: it’s genuinely useful for automating the data collection and categorization phases, and for flagging variance anomalies that human reviewers miss. But the analytical judgment — choosing the right method, identifying the right cost categories, interpreting the output — still requires a human who understands the business context. AI accelerates the analysis; it doesn’t replace the analyst.
Underinvesting in technology and automation is a common financial mistake that silently drains resources — outdated workflows, clunky legacy systems, or manual processes may seem like minor inconveniences, but collectively they steal hours of productive time every week. The irony is that the cost of not adopting better tools is itself a cost that most businesses never bother to analyze.
Quick-Reference Checklist for Any Cost Analysis
Save this. Run through it before finalizing any cost analysis that informs a significant decision.
| Phase | Checkpoint | Done? |
|---|---|---|
| Scope | Decision question written in one precise sentence | ☐ |
| Scope | Time horizon explicitly defined and justified | ☐ |
| Costs | Direct costs identified and sourced | ☐ |
| Costs | Indirect/overhead costs allocated by method | ☐ |
| Costs | Hidden cost checklist reviewed (compliance, turnover, technical debt, subscription creep) | ☐ |
| Costs | Change management and training costs included | ☐ |
| Costs | Opportunity costs acknowledged (even if not quantified) | ☐ |
| Method | Primary analysis method selected and justified | ☐ |
| Method | Secondary method applied as cross-check | ☐ |
| Sensitivity | Top 3 assumptions identified | ☐ |
| Sensitivity | Sensitivity analysis run at ±20% on key variables | ☐ |
| Output | Conclusion stated as a clear recommendation, not just data | ☐ |
| Output | Confidence level and key assumptions disclosed | ☐ |
| Review | Independent reviewer has checked key assumptions | ☐ |
“The value of a cost analysis isn’t in the number it produces — it’s in the assumptions it forces you to make explicit.”
Cost analysis isn’t glamorous work. It won’t go viral and it won’t earn a standing ovation. But it is the discipline that separates businesses that make money on purpose from those that make money by accident — and only until the accident stops happening.
The companies consistently generating returns, the ones that navigate recessions without existential panic and deploy capital into AI or automation with actual confidence — they’ve all internalized the same habit. They look at costs with clear eyes, no wishful thinking, and no convenient omissions. That discipline, applied consistently, is worth more than almost any individual insight the analysis might reveal.
Start with the checklist above. Pick the simplest upcoming decision your team faces, run it through the full process, and see what you find. The answer might confirm what you already thought. Or it might change your mind about something that matters. Either way, you’ll know.
Primary Data Sources
S&P Global (2025) — AI Project Abandonment Survey · Forrester Research / WRITER Total Economic Impact Study (2025) · PwC UK — Cost of Payroll Errors in FTSE 100 · Ernst & Young — Payroll Error Rate Analysis · McKinsey & Company — GenAI Value Survey (2025) · Klarna — Annual Report & AI Implementation Data (2024) · CostPerform — Common Cost Analysis Mistakes (2025) · Preferred CFO — Cost & Price Analysis Guide (2025) · Mindspace Outsourcing — Cost Analysis in Accounting (2025) · Master of Code — AI ROI Study (2026) · Acropolium — AI Agent Unit Economics (2025)
More from Trendix
Explore related guides, tools, and analysis on trendix.tech
Sources & References
Verified external sources cited in this guide
0 responses to “Cost Analysis: The Complete 2026 Guide”