

Web Performance · SEO · Technical Guides
Speed & Performance Tests: The Definitive 2025–2026 Guide
Everything you need to know — from Core Web Vitals thresholds to real-world conversion data, the right testing tools, and how to actually fix what’s broken.
Why Speed Is a Business Problem, Not Just a Technical One
There’s a peculiar gap in how most organizations think about website performance. Developers know it matters. Marketing teams vaguely nod along. Leadership often sees it as a line item on a quarterly backlog, somewhere between “update the footer” and “fix broken links.” That gap is costing real money.
The data, compiled from sources including Deloitte, Google’s own Think with Google research, and the Web Almanac, isn’t subtle about this. A 0.1-second improvement in page speed boosts customer spending by 10% for retail sites. Amazon’s famous internal study from the early days of AWS found that every 100 milliseconds of added latency cost 1% in sales — a number that, extrapolated to 2025 revenue, would represent billions. These aren’t rounding errors.
Sites loading in one second achieve conversion rates roughly three times higher than those requiring five seconds — not 10% better, not slightly better, three times. The probability of a bounce increases 32% when load time goes from one second to three seconds, and jumps to 90% when it goes from one second to five.
What makes 2025 different from earlier years is that Google has formalized much of this understanding into ranking signals. Speed isn’t just about users anymore — it directly affects your ability to get found at all. And the goalposts, as we’ll see, have moved significantly in the past 18 months.
Only 47% of websites currently meet all of Google’s Core Web Vitals thresholds, according to CrUX data across 10+ million sites. That means more than half the web is failing a test that directly influences search rankings. This is both a problem and, depending on which side of it you’re on, an opportunity.
Core Web Vitals in 2025–2026: What Changed and Why It Matters
If you haven’t revisited your understanding of Core Web Vitals since 2023, you’re working from an outdated map. The landscape shifted meaningfully, and the December 2025 Google update formalized changes that had been rolling out since early 2024.
The most significant shift: Google formally replaced First Input Delay (FID) with Interaction to Next Paint (INP) as the responsiveness metric in March 2024, with the December 2025 update raising the weight these signals carry in ranking algorithms. On paper, this looks like a minor metric swap. In practice, it represents a fundamentally different test of how your site behaves under real user pressure.
FID only measured the delay before the browser began processing the very first interaction. You could have a site that snapped responsively on the first click, then crawled through every subsequent interaction, and FID would still give you a green score. INP doesn’t let you get away with that.
“Your site might respond instantly to the first click, but if it gets slower with each interaction, that’s now measurable and important.”
— RoastWeb CWV Analysis, January 2026INP measures the 95th percentile of all interactions — meaning if you have 100 user interactions, the 95th slowest one counts toward your score. Think about what that means for an e-commerce product page where users click filters, open accordions, add to cart, and interact with image galleries. Every single one of those interactions is now being graded.
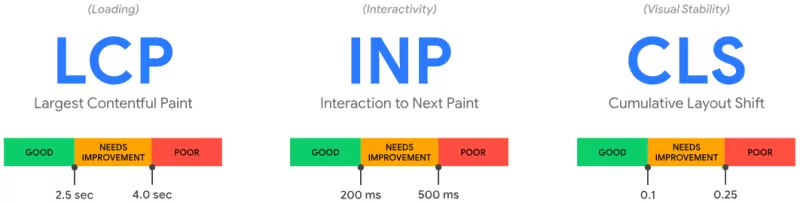
According to Google’s official Search Central documentation, the current good thresholds are:
| Metric | Good | Needs Improvement | Poor | What It Measures |
|---|---|---|---|---|
| LCP — Largest Contentful Paint | ≤ 2.5s | 2.5–4.0s | > 4.0s | When the main content becomes visible |
| INP — Interaction to Next Paint | ≤ 200ms | 200–500ms | > 500ms | Responsiveness across all interactions |
| CLS — Cumulative Layout Shift | ≤ 0.1 | 0.1–0.25 | > 0.25 | Visual stability during page load |
One thing that trips people up: these thresholds apply at the 75th percentile. To pass Core Web Vitals, at least 75% of your page visits must meet the “Good” threshold — not your average load, not your best case. Three-quarters of real user sessions need to clear the bar. That’s a tougher standard than most people realize when they first start optimizing.
Getting a “Good” LCP on PageSpeed Insights lab tests and assuming you’ve passed. Lab data shows what can happen under controlled conditions. What matters for Google rankings is the CrUX field data — real measurements from actual Chrome users visiting your site over the past 28 days. These can diverge by a significant margin, especially on complex JavaScript-heavy pages.
According to the 2025 Web Almanac, only 62% of mobile pages achieve a good LCP score, making it the hardest Core Web Vital to pass. LCP is where most sites struggle first, and it’s also where the highest-impact wins tend to live.
LCP, INP, CLS — Going Deeper Than the Definitions
Largest Contentful Paint (LCP)
LCP is intuitively understood but often misdiagnosed. It’s not just “how fast the page loads” — it specifically measures when the largest visible element in the viewport finishes rendering. That’s usually a hero image, a large heading, or a video thumbnail. The fact that it’s the largest element matters because that’s typically what users perceive as the page “being ready.”
The most impactful causes of poor LCP, in rough order of how often they appear in audits:
- Unoptimized hero images. A 2MB JPEG hero served without compression or next-gen format conversion is probably the single most common LCP killer in the wild. Switching to WebP or AVIF typically cuts file size by 25–50%.
- Missing
fetchpriority="high"on the LCP image. Browsers don’t automatically know which image is your LCP element. This one attribute can cut LCP by hundreds of milliseconds. - Slow TTFB (Time to First Byte). If the server itself takes 800ms to respond, you’ve burned most of your LCP budget before a single asset loads. CDNs and server-side caching are the levers here.
- Render-blocking resources. CSS and JavaScript loaded synchronously in the
<head>before the LCP element gets a chance to paint.
Interaction to Next Paint (INP)
INP is where developers tend to underestimate the problem. If your site is WordPress with twenty active plugins, a heavy analytics suite, a live chat widget, and a cookie consent manager — your INP on mobile is almost certainly in the “Needs Improvement” range, possibly “Poor.” Each of those third-party scripts takes CPU time to execute, and on mid-range Android devices (which represent a large share of global mobile traffic), there’s just not that much CPU to go around.
According to emerging AI-powered optimization tools and 2025 industry research, automated script optimization can reduce INP by up to 30%, but the fundamentals still apply: break up long JavaScript tasks into smaller chunks, defer non-critical scripts, and be ruthless about auditing third-party embeds.
The practical question to ask isn’t “what’s our INP score?” — it’s “what happens when a user on a 4G connection and a budget phone tries to interact with our most complex page?” That’s the real test.
Cumulative Layout Shift (CLS)
CLS is the metric users feel even when they can’t name it. You’ve experienced it: you’re about to tap a button, an ad loads above it, and you accidentally tap the ad. That’s a layout shift. Yahoo! JAPAN, after fixing a massive CLS issue, saw 15.1% more page views per session, 13.3% longer session duration, and a 1.72% lower bounce rate. Those aren’t trivial gains from a metric most people treat as secondary.
The most reliable CLS fixes: always specify explicit width and height attributes on images and video elements, reserve space for dynamic content like ads or banners before they load, and avoid inserting content above existing content without pre-reserved space. CSS animations using transform instead of margin or position also prevent a common category of unexpected shifts.
The Best Speed Testing Tools in 2025–2026 (Compared Honestly)
There’s a lot of confusion here, and some of it is intentional — tool vendors have an interest in making their scores look authoritative. The honest answer is that no single tool tells the full story, and the specific tool you should reach for depends entirely on what question you’re trying to answer.
The key distinction most guides skip: lab data (Lighthouse, GTmetrix, WebPageTest) measures potential performance under controlled conditions. Field data (CrUX via PageSpeed Insights) measures actual user experience. Only field data affects Google rankings. That’s not a minor footnote — it’s the whole framework.
Google PageSpeed Insights
The official Google tool, powered by Lighthouse for lab data and Chrome User Experience Report (CrUX) for real-user field data. The only testing tool that shows you the actual data Google uses for ranking decisions.
GTmetrix
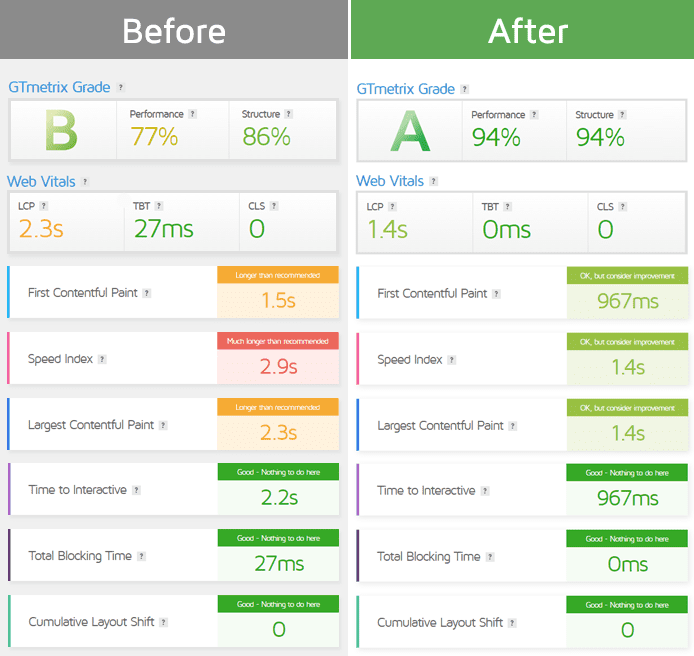
Lighthouse-based testing with waterfall charts, filmstrip view, and video recording of page loads. The cleanest, most readable reports of any major tool — good for presenting findings to non-technical stakeholders.
WebPageTest (Catchpoint)
The most technically capable of the major free tools. Real browser testing from 40+ global locations, packet-level network throttling, custom scripting for multi-step flows. Steep learning curve but unmatched depth.
Pingdom Website Speed Test
One of the oldest tools in the space, built primarily for uptime monitoring with solid speed testing on the side. Less technically detailed than WebPageTest or GTmetrix, but reliable for quick checks and infrastructure teams.
Chrome DevTools / Lighthouse
The native browser profiler — the same engine behind most other tools, run locally. Gives you the most flexibility: test behind authentication, inspect JavaScript execution profiles, run performance traces directly in your browser.
DebugBear
A newer but increasingly well-regarded tool that combines the accuracy of packet-level throttling (like WebPageTest) with a cleaner interface and actionable optimization suggestions. Good middle ground between GTmetrix and WebPageTest.
Side-by-Side Tool Comparison
| Feature | PageSpeed Insights | GTmetrix | WebPageTest | Pingdom | Chrome DevTools |
|---|---|---|---|---|---|
| CrUX Field Data (real users) | ✅ Yes | ✅ Via CrUX | ❌ No | ❌ No | ❌ No |
| Selectable Test Location | ❌ No | ✅ Free / Paid | ✅ 40+ locations | ✅ Several | N/A (local) |
| Waterfall Chart | ❌ No | ✅ Yes | ✅ Advanced | ✅ Basic | ✅ Full |
| Historical Monitoring | ❌ No | ✅ Free / Paid | Enterprise | ✅ Paid | ❌ No |
| Mobile Testing (free) | ✅ Yes | Paid only | ✅ Yes | Limited | ✅ Emulated |
| Custom Test Scripts | ❌ No | Paid | ✅ Free | ❌ No | ✅ Full |
| Core Web Vitals Report | ✅ Primary | ✅ Yes | ✅ Yes | Basic | ✅ Yes |
| Reflects Google Rankings? | ✅ Closest | Partial | ❌ No | ❌ No | ❌ No |
| Best Use Case | Primary check | Diagnostics / reporting | Deep technical audits | Infra monitoring | Dev debugging |
The Right Testing Workflow (Most People Get This Wrong)
The most common mistake: running one tool, seeing the score, and treating that number as definitive. It isn’t. You can run PageSpeed Insights and get 62, then test on GTmetrix and see 94%, and WebPageTest can show an LCP of 1.8s while your CrUX data says real users experience 3.2s. All of those numbers can be technically accurate and simultaneously misleading if you don’t understand what each is measuring.
Here’s the workflow that actually reflects how performance engineers approach this professionally:
Step 1 — Establish Your Baseline With Real User Data
Start with Google Search Console → Core Web Vitals report. This shows you which URLs are failing, which are passing, and at what percentile. It’s the ground truth — the actual signal Google is using for your rankings. If you don’t have this configured, configure it before anything else.
Step 2 — Run PageSpeed Insights
For any URL flagged in Search Console, run it through PageSpeed Insights. Check the “Discover what your real users are experiencing” section first — that’s the CrUX field data. Then look at the Lighthouse lab data and Opportunities section for specific, actionable recommendations. Run 3–5 tests and use the median score, not a single run.
Step 3 — Use WebPageTest for Location-Specific Diagnosis
If your users are primarily in Europe, Southeast Asia, or Australia, testing only from US-based servers will give you misleadingly good results. WebPageTest offers locations including Amsterdam, Frankfurt, and London, and testing from the closest node to your actual users will reveal TTFB issues that US-based tests completely miss.
Step 4 — Use GTmetrix for Waterfall Analysis
Once you know what’s slow, GTmetrix’s waterfall chart is the cleanest way to pinpoint exactly which resources are blocking the critical rendering path. The filmstrip view — showing screenshots of the page at each 100ms interval — is particularly useful for identifying exactly when content first becomes visible to users.
Step 5 — Validate With Chrome DevTools for JavaScript Profiling
If INP is your problem, the answer is usually in JavaScript execution time, and DevTools is the only tool that gives you a proper CPU flame graph. This is where you identify long tasks that block the main thread and find the specific functions responsible.
Step 6 — Set Up Continuous Monitoring
Performance regresses. New plugins get installed, images get added without compression, third-party scripts get updated and become heavier. Set up monitoring (GTmetrix Pro, DebugBear, or similar) to alert you when key pages drop below your performance budget thresholds. Catching a regression the day it happens is vastly cheaper than diagnosing it six weeks later when rankings have dropped.
Industry Benchmarks: What “Good” Actually Looks Like
Abstract thresholds are one thing. Knowing where your site stands relative to actual competitors in your industry is more useful.
| Industry | Avg. Mobile Load Time | Top 25% Load Time | Bounce Rate Impact (<2s) | CWV Pass Rate (mobile) |
|---|---|---|---|---|
| E-commerce | 4.2s | 2.1s | –32% bounce | ~38% |
| SaaS / Technology | 3.8s | 1.8s | –28% bounce | ~44% |
| Media / News | 5.6s | 2.9s | –41% bounce (for <3s) | ~29% |
| Travel & Booking | 4.9s | 2.4s | –35% bounce | ~35% |
| B2B Services | 4.1s | 2.0s | –29% bounce | ~41% |
| Financial Services | 3.6s | 1.9s | –26% bounce | ~46% |
Sources: RoastWeb 2025 Mobile Performance Index, Pingdom/GTmetrix aggregate data, HTTP Archive Web Almanac 2025
A few observations worth noting: media and news sites consistently have the worst average performance because they carry the heaviest third-party script load — ads, analytics, social embeds, comment systems. The irony is that these are often the sites most reliant on organic search traffic. And e-commerce, where speed most directly correlates to revenue, still sees the average mobile experience at 4.2 seconds — nearly double the “Good” threshold.
According to Tooltester research, the global average mobile web page load time is 8.6 seconds — nearly three times the recommended 3-second benchmark. In the US and UK, averages are better (around 1.8–1.9 seconds), but for businesses serving global audiences, this is a stark reminder that CDN coverage and regional optimization aren’t optional.
Real-World Case Studies: What Performance Actually Delivers
Numbers from studies are useful. Numbers from companies that actually shipped improvements and measured the results are better. Here are some of the most instructive cases from the WPO Stats database and Google’s own web.dev case study archive.
Case Study · E-commerce
Rakuten 24: The CWV Turnaround
One of the most-cited Core Web Vitals case studies in the industry. Rakuten ran a controlled A/B test comparing their old experience against an optimized version with improved LCP, CLS, and FID (the FID predecessor to INP). The results were striking enough that they’ve been referenced in Google’s own optimization guides.
Case Study · Retail
Vodafone: 31% LCP Improvement
Vodafone’s A/B test revealed that a 31% improvement in LCP boosted lead-to-visit rate by 15%, cart-to-visit rate by 11%, and sales by 8%. What makes this case particularly useful is the proportionality — a relatively modest improvement in a single metric (LCP) produced measurable gains across the entire purchase funnel, not just at the top.
Case Study · Mobile Commerce
Swappie: 42% Mobile Revenue Lift
Swappie, after improving Core Web Vitals and cutting load time by 23%, saw a 42% increase in mobile revenue. This is one of the more dramatic revenue outcomes in the CWV case study record, and it’s especially instructive because it came entirely from mobile optimization at a time when their mobile traffic was already substantial.
Case Study · Content Platform
Relive: CWV Optimization in 2025
Relive achieved over 50% faster LCP and near-zero layout shifts (CLS) across all key pages, resulting in a 3% increase in conversion rate, a 6% decrease in bounce rate, and a 9% increase in page views per session. Not every outcome is a 40% revenue jump — sometimes a clean, disciplined optimization effort delivers steady, compounding gains across multiple metrics.
Case Study · INP-Specific · 2024–2025
Contentsquare: The INP–Conversion Relationship
Contentsquare aggregated data from 997 customer sites and found that users experiencing good INP had a 25% better conversion rate than users experiencing poor INP. Users with poor INP were also more likely to bounce and exhibit frustration behaviors like rage clicks. This is among the cleaner data sets establishing a direct causal relationship between the newest Core Web Vitals metric and business outcomes.
The Optimization Checklist: What to Fix and in What Order
Priority should follow impact × effort. These are ordered roughly by how often each item is responsible for Core Web Vitals failures and how accessible the fix typically is.
LCP Optimizations
- Add
fetchpriority="high"to your LCP image element - Convert hero images to WebP or AVIF format
- Set explicit width and height attributes on all images above the fold
- Preload the LCP image with
<link rel="preload" as="image"> - Achieve TTFB under 200ms — use a CDN if you’re not already
- Remove render-blocking CSS and JS in the
<head> - Enable server-side caching for HTML responses
- Avoid lazy-loading the LCP image — it’s counter-productive for above-the-fold content
INP Optimizations
- Audit all third-party scripts and remove or defer non-critical ones
- Break up long JavaScript tasks (tasks >50ms) into smaller chunks
- Use
scheduler.yield()orsetTimeout(0)to yield to the browser between tasks - Defer analytics, chat widgets, and tracking pixels until after page load
- Move heavy computation off the main thread with Web Workers
- Profile with Chrome DevTools Performance panel to find the specific long tasks
- Cookie consent managers are a frequent INP culprit — audit their execution time
CLS Optimizations
- Set explicit width and height on all
<img>and<video>elements - Reserve space for ad slots and dynamic content with min-height
- Avoid inserting content above existing content without reserved space
- Use CSS
transformanimations instead of animatingtop,left,margin - Preload web fonts to prevent FOUT (flash of unstyled text) causing shifts
- Be cautious with any content that loads asynchronously above the fold
General Performance
- Minify CSS, JavaScript, and HTML
- Enable HTTP/2 or HTTP/3 on your server
- Implement lazy loading for images below the fold
- Use a Content Delivery Network (CDN) for static assets
- Enable Brotli compression (better than gzip for most text assets)
- Audit and remove unused CSS (can reduce render-blocking significantly)
- Reduce DNS lookups by limiting distinct domains for critical resources
- Heavy WordPress themes and unused plugins are responsible for a disproportionate share of performance failures for SMB sites
The Mobile Problem Nobody Talks About Enough
Everyone says “mobile-first.” Not everyone has actually sat down and tested their site on a mid-range Android device on a 4G connection in a country where mobile networks are congested.
In 2025, 73% of e-commerce traffic comes from mobile devices. Webpages take 70.9% longer to load on mobile compared to desktop, on average. And only 43.4% of mobile sites meet Google’s Core Web Vitals thresholds, compared to 54% of desktop pages. You can do the math: more than half your mobile visitors are likely having a “Poor” or “Needs Improvement” experience, and that group is also your majority traffic source.
Google’s PageSpeed Insights mobile test simulates a Moto G Power (a representative mid-range device) on throttled 4G. If that sounds like a pessimistic test setup, it’s actually a reasonable approximation of real-world conditions for a substantial portion of global mobile users. The goal isn’t to pass the Moto G test specifically — it’s to understand that your performance bar needs to be set for devices and network conditions more constrained than the MacBook on your desk.
“Poor mobile speed reduces mobile conversions by up to 50%. Retail sites lose $2.6 billion annually due to slow load times. These are not fringe scenarios.”
— Composite from Google Consumer Insights, Portent, and Yottaa 2025 Web Performance IndexA practical suggestion: once a quarter, test your checkout flow or highest-converting landing page in Chrome DevTools with the Network throttling set to “Slow 4G” and the CPU throttling set to 4×. Then record what you see. It’s often the most productive performance conversation you can have with a team that thinks the site is fast because it loads quickly on their office WiFi.
Field Data vs. Lab Data: Understanding the Critical Distinction
This distinction matters more than almost anything else in web performance, and it’s genuinely confusing — partly because several major tools show both types in the same interface without making it completely clear which is which.
Lab Data (Synthetic)
Lab data is collected by running a controlled test in a specified environment: specific hardware, specific network throttling, specific browser version, from a specific server location. Lighthouse, GTmetrix, WebPageTest, and Pingdom all produce primarily lab data. It’s highly reproducible (within a variance range) and excellent for diagnosing specific issues. It tells you what your site can do under defined conditions.
Field Data (Real User Measurement)
Field data is collected from actual users visiting your site with their real devices, their real network connections, from their real locations. Google collects this via the Chrome User Experience Report (CrUX), which aggregates anonymized performance data from Chrome users and makes it available for any URL with sufficient traffic. PageSpeed Insights is the only testing tool that shows CrUX field data — the actual data Google uses for page experience ranking signals.
Why They Diverge
Field data and lab data often show different numbers — sometimes significantly. A few reasons this happens:
- Your real users may be primarily on mobile devices and slow connections, while your lab test used a fast desktop emulation.
- Lab tests don’t capture the full impact of third-party scripts that load asynchronously and behave differently depending on real user data (like personalization or A/B test variants).
- CrUX data is averaged over 28 days — it captures the full distribution of user experiences, including edge cases your lab tests don’t see.
If your CrUX Core Web Vitals show green in PageSpeed Insights, your SEO page experience signals are passing — regardless of what GTmetrix grade says. If your CrUX shows amber or red, no Lighthouse score above 90 will compensate for it. Fix the field data problem, not the lab score.
Frequently Asked Questions
How much do Core Web Vitals actually affect my Google rankings?
According to 2025 industry research, Core Web Vitals account for approximately 10–15% of ranking signals. They’re confirmed ranking factors, not the dominant factor (content relevance still leads), but in competitive SERPs where multiple pages have comparable content quality, Core Web Vitals performance can be the tiebreaker. Sites that meet all three CWV thresholds see a roughly 8–15% visibility boost in search results, per the data.
Why do I get different scores from different tools?
Performance scores vary because different tools use different methodologies and configurations. Test server location, network throttling method, CPU speed, browser version, and how Lighthouse is implemented all contribute to differences. None of them is “wrong” — they’re measuring under different conditions. The practical answer: focus on CrUX field data for SEO, and use lab tools to diagnose specific issues, not as scorecards.
My PageSpeed score is 90+. Am I done?
Not necessarily. Check your CrUX field data in the same PageSpeed Insights report — particularly the Core Web Vitals assessment at the 75th percentile. A 90+ Lighthouse score can coexist with failing field data if, for example, your real-user base is predominantly on mobile devices or slower connections than the lab test simulates.
How often should I run speed tests?
After any significant deployment (new theme, plugin additions, content changes), after major third-party scripts are added or updated, and on a regular schedule — weekly for high-traffic pages, monthly for others. Set up automated monitoring if you can: catching a regression in 24 hours is far better than noticing a ranking drop three weeks later.
Is AMP still relevant in 2025?
No, not really. Google removed AMP as a preferential ranking signal in 2021. The correct approach now is building a fast standard web experience that passes Core Web Vitals on regular pages. Resources spent maintaining AMP pages are almost always better spent on general performance optimization.
What’s a realistic target for a small business WordPress site?
Aim for: LCP under 2.5s on mobile, INP under 200ms, CLS under 0.1, PageSpeed Insights mobile score of 70+ (higher is better, but 70+ is the pragmatic threshold where you’re not being penalized). The most impactful levers for WordPress: a fast hosting provider, a lightweight theme, image optimization with WebP conversion, and deferring non-essential plugins. This combination alone can often move a typical WordPress site from failing to passing Core Web Vitals without touching the theme or rebuilding anything.
Performance optimization isn’t a project with a finish line. It’s a discipline. Algorithms evolve, third-party scripts get heavier, content teams add images without checking file sizes, and new JavaScript frameworks introduce their own interaction bottlenecks. The sites that consistently rank well on speed aren’t the ones who fixed it once three years ago — they’re the ones who built measurement into their development workflow and treat performance regressions as bugs worth tracking. The tools, the thresholds, and the case studies are all pointing in the same direction: fast sites win. The gap between the median site and the top 25% is large enough that almost any sustained optimization effort pays off.
More from Trendix.tech
Privacy Policy
Google Still Cares About Mobile-First Indexing — Here’s Why You Should Too
Writing & Content AI: The Definitive Guide
Content Marketing for Solo Founders: Systems That Run on Autopilot
NotebookLM for Researchers: A Deep Dive Into the Most Underused AI Tool
Perplexity Comet & the AI Personal Computer: Everything Explained