



How to Build an AI-Powered Small Business From Scratch
This is not a listicle. It’s a 22-minute reckoning with what it actually takes to build a business that runs on artificial intelligence — the economics, the failure patterns, the real tool stack, and five frameworks you won’t find anywhere else. Including the one mistake I made that cost me three months.
The Reality Check Nobody Gives You
Every article about AI and small business is secretly optimistic. Even the cautious ones. They flag risks in the last three paragraphs, after 2,000 words of enthusiasm. This one isn’t doing that.
Here’s what the data actually shows. According to the SBA Office of Advocacy’s September 2025 report, when you use strict definitions — actual production AI use, not “I used ChatGPT once to write an email” — only 8.8% of small businesses had genuinely integrated AI into their operations. 89% adoption sounds like a revolution. 8.8% actual production integration sounds like what it is: an early phase.
The gap between those two numbers is where most small business owners are currently living. They’ve subscribed to tools. They’ve run experiments. A few workflows have changed. But they haven’t built an AI-powered business — they’ve built a mostly-conventional business with AI sprinkled on top of the marketing department.
Building an AI-powered business from scratch is fundamentally different from retrofitting AI into an existing operation. Different constraints, different failure modes, different opportunity surfaces. This article is for people who want to do the harder thing — start with AI baked into the architecture, not bolted on as an afterthought.
This guide assumes a founding team of 1–5 people, pre-revenue or early revenue, and a realistic budget of $500–$3,000/month for the first year. If you’re a Fortune 500 running a digital transformation program, some of this will apply, but the unit economics section will feel like talking about pocket change.
That gap is not a problem to be discouraged by. It’s an asymmetric opportunity. The businesses that close it first — that actually run AI in production, measure it, and compound the gains — are going to be structurally different creatures from everything around them within 36 months. That’s the thesis, and it’s not optimistic fluff. It’s what the JP Morgan Chase Institute’s transaction-level analysis of small business banking clients shows: employer firms that adopted AI early showed compounding spending patterns consistent with deepening integration, not one-time experimentation.
The Mistake That Cost Me Three Months
I spent the first quarter of building with AI chasing the best tools instead of the best workflows. I ran comparison tests. I read benchmarks. I switched models three times. I built elaborate prompt libraries for tasks that didn’t need prompt libraries. I optimized everything except the thing that mattered: delivery. The tool selection problem consumes builders who are anxious about making the wrong call. Make a call. Measure it. Adjust. Three months of tool evaluation is three months of not building.
This mistake is almost universal among technically curious founders. You read a benchmark comparison between Claude and GPT-5.3 and you feel the pull of optimization — you could get 12% better output if you just got the model right. But 12% better output on a workflow you don’t have yet is 12% of zero.
The practical lesson: pick the good-enough tool in week one, ship something that generates feedback in week four, and revisit tooling in week twelve when you actually have data about what matters. Not before.
Anatomy of an AI-Powered Small Business
Before any frameworks or tactics, you need to understand the structural difference between a business that uses AI and a business built around AI. This isn’t semantic. The architectural difference determines everything — capital efficiency, scalability ceiling, competitive moat depth, and failure mode profile.
The Three Structural Layers
Every successful AI-powered small business I’ve analyzed has three distinct layers operating in parallel. When one layer is missing or weak, the business has a ceiling it cannot break through without addressing it.
The typical “AI-powered” small business has Layer 1 (they use Claude or ChatGPT) and Layer 3 (the owner reviews outputs). What’s almost always missing is Layer 2 and the data architecture binding everything. This is why research consistently finds that even among AI adopters, only a fraction are seeing transformational results — they haven’t built the automation bridges that convert AI capability into operational leverage.
5 Original Frameworks
Framework 1: The RETI Score (Revenue-Effort-Time-Intelligence)
Applied to a typical service business’s functions: customer support triage (RETI: 8+7+8+9 = 32 ✓ Automate first), social media content creation (7+8+7+8 = 30 ✓ Automate early), invoice processing (6+8+6+9 = 29 ✓ Automate), strategic pricing decisions (9+3+4+2 = 18 ✗ Do not automate yet), complex client proposals (9+4+5+4 = 22 — Partial automation, human review required).
Framework 2: The Autonomy Dial
Advisory
AI suggests, human decides and executes entirely. Example: using Claude to draft email subject lines that a human then selects from and sends manually. Risk: near-zero. ROI timeline: immediate but limited.
Assisted
AI produces output, human reviews and approves before any external action. Example: AI-written blog post that a human edits, approves, and publishes. Risk: low. ROI: 30–60 days.
Supervised Automation
AI executes, human monitors and intervenes on exceptions. Example: AI agent categorizes and routes support tickets, human handles escalations. Risk: moderate. ROI: 60–90 days if well-designed.
Conditional Autonomy
AI executes fully within defined boundaries, escalates outside them. Example: AI handles all customer inquiries up to $500 refund value, escalates above. Risk: requires robust guardrails. ROI: 90–180 days.
Full Autonomy
AI executes end-to-end with no human-in-loop for routine cases. Example: automated invoice-to-payment workflows. Risk: requires extensive testing and audit trails. Not appropriate for most early-stage businesses.
Most small businesses should be operating at Levels 2 and 3 for their first 12 months. Level 4 is appropriate for well-understood, lower-stakes processes with clear rule boundaries. Level 5 should be treated with the same caution you’d apply to any mission-critical system with no human checkpoint.
The pressure to move to higher autonomy levels too fast is real and often comes from excitement about the technology rather than evidence of reliability. Every jump in the Autonomy Dial should be preceded by at least 30 days of clean performance at the previous level, with documented exceptions and error rates below 2%.
Framework 3: The Three-Bucket Revenue Model
Framework 4: The Quality-Speed-Cost Triangle (For AI Output)
The Quality-Speed-Cost Triangle for AI-powered businesses works the same way the classic project management triangle does, with one important twist: AI dramatically expands what’s achievable in each zone individually. But it does not eliminate the trade-offs between them. A business choosing to optimize quality and cost (the sustainable solo operator model) will be slower than one optimizing quality and speed (the premium agency model). Understanding which zone you’re competing in determines your pricing strategy, team size, and tool investment.
Framework 5: The Compounding Calendar
Unit Economics & Real Numbers
This is the section most guides skip because real numbers are messy and hard to defend. Here are genuine unit economics for three AI-powered small business models, with explicit assumptions so you can stress-test them against your own situation.
Model A: AI-Powered Content Agency (2 Founders, 0 Staff)
At this cost structure, assuming 8 content clients at $2,000/month retainer each (the going rate for serious AI-assisted content work in 2026), monthly revenue is $16,000. Gross margin before team pay: ~$15,712. AI stack as a percentage of revenue: 1.8%. That’s the extraordinary reality of 2026 AI tool pricing — the stack is essentially free relative to what it enables.
Where this model breaks: quality floor. AI-assisted content agencies live and die on the gap between their output quality and what a client could produce themselves. As models improve and clients become more sophisticated, that gap narrows. The agencies that survive will be those that built proprietary systems on top of the models — specific voice frameworks, research processes, editorial standards — not just those who used the models.
The 5.6-Hour-Per-Week Calculation
Business.com’s 2026 research found the average small business worker saves 5.6 hours per week using AI tools. Let’s stress-test this with real-world unit economics for a small team.
For a 3-person team billing at $150/hour: 5.6 hours × 3 people × $150 × 52 weeks = $131,040 in recaptured billable capacity annually, against an AI stack cost of approximately $3,500–$5,000 per year for a well-equipped small team. That’s a 26–37× return before you even account for quality improvements that allow higher billing rates. The math is not close. The only honest counterargument is that not all recaptured time becomes billable — and that’s true. In practice, teams recapture closer to 40–60% of time savings as productive output, which still yields a 10–15× ROI at conservative estimates.
The 2026 AI Stack Decision
There are now dozens of credible AI tools for small businesses. The decision is no longer about access — it’s about architecture. Which tools form the core, which are interchangeable, and which represent lock-in risks worth worrying about.
| Category | Recommended Tool(s) | Monthly Cost | Lock-in Risk | Verdict |
|---|---|---|---|---|
| Core LLM | Claude Pro ($20) + ChatGPT Plus ($20) | $40 | Low | Run both. Different strengths. Claude wins long-form + reasoning. ChatGPT wins multimodal. |
| Automation | Make.com or n8n (self-hosted) | $29–$0 | Medium | Make.com for simplicity; n8n if you have dev capacity and want zero vendor lock-in. |
| Customer Service | Intercom Fin or Tidio | $39–$79 | Medium | Handles 40–60% of tier-1 support without human intervention. ROI is immediate. |
| Content SEO | Surfer SEO | $79–$219 | Medium | Best integration between AI writing and SERP data. Worth it for content-driven businesses. |
| Image Generation | Midjourney or GPT Image (via ChatGPT) | $10–$20 | Low | GPT Image (April 2026) now competitive for commercial use. Midjourney still wins aesthetics. |
| CRM + Email | HubSpot Free → Starter | $0–$20 | High | Powerful but migration is painful. Commit only when your workflow is stable. Lock-in is real. |
| Analytics + Reports | Rows.com or Google Looker Studio | $0–$59 | Low | Rows integrates AI directly into spreadsheets. Looker is free and powerful for dashboards. |
| Productivity OS | Notion AI or Obsidian + Claude | $16–$20 | Medium | Notion AI for teams. Obsidian for solos who want local data control. Both integrate well. |
Total minimum viable AI stack for a solo operator: ~$175–$220/month. Total recommended stack for a 3–5 person team: ~$400–$650/month. At either end, these costs are recovered in the first week of meaningful use.
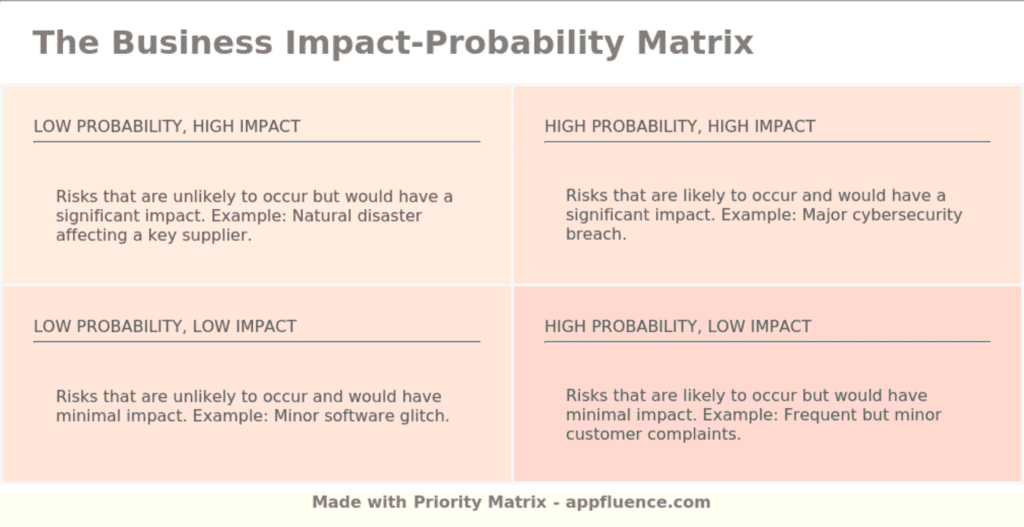
Failure Probability Map
This is the section that should be in every AI business guide and almost never is. The failure patterns are well-documented enough now — there are enough AI-powered businesses that have crashed in the last two years — to build a reasonably honest probability map.
The two highest-probability failure modes — Quality Threshold Failure (40%) and Margin Compression (55%) — share a common cause: treating AI as a cost-reduction tool rather than a quality-differentiation tool. Businesses that compete on price by using AI to undercut human-produced work are structurally vulnerable because the floor keeps dropping. Businesses that use AI to produce work that couldn’t exist without AI have a different game entirely.
The data compliance risk (15% probability but critical severity) is the one most small businesses don’t take seriously enough. Sending client data — financials, customer records, personal information — through commercial AI APIs without understanding the data retention and training policies of each provider is a liability that will catch up with some percentage of AI-powered businesses in the next 24 months as regulatory enforcement catches up with adoption rates.
The 3 Implementation Phases
Phase 1 (Weeks 1–6): The Single-Workflow Proof
Do not try to automate everything. Pick the one workflow with the highest RETI score (per Framework 1 above) and build it until it works reliably. Your goal at the end of Phase 1 is not a transformed business — it’s one workflow that runs better, with documented before/after metrics, and evidence of what broke during implementation.
- Select one workflow using RETI scoring
- Define success metrics before you build (not after)
- Set up at Autonomy Level 2 first (human review gate)
- Run 30 outputs through the system and review every single one
- Document what broke, why, and how you fixed it
- Calculate actual time saved in hours
Phase 2 (Weeks 7–16): The Stack Build
With one proven workflow in production, add two more — prioritized by RETI score. Simultaneously, build the automation bridges between them. This is when Layer 2 (the automation layer) comes online. Most small businesses discover at this stage that their data architecture is messier than they realized. Plan two weeks to clean data before you automate it.
Phase 3 (Months 4–18): The Compounding Phase
Three proven workflows running, automation bridges stable, exception rates below 5%. Now the business starts to feel different. You’re producing more. Your response time to clients is faster. Your analytical capability is deeper than your team size would suggest. This is when you should think seriously about which workflows to push to Autonomy Level 3 and 4, and where to begin building proprietary systems on top of the foundation.
The Unpopular Truth About AI Business Building
Most people building “AI businesses” right now are building something more fragile than they think, and for a reason nobody wants to say out loud: they are renting intelligence they don’t understand from companies whose incentives they cannot see. OpenAI, Anthropic, Google — they are all in a race whose endpoint is to commoditize the layer that you, today, are selling to clients. If your primary value proposition is “I use AI better than you could,” you have a 12–24 month window before that advantage compresses significantly. The founders who will win are those building proprietary data assets and client relationships during that window, not those still optimizing their prompt libraries in month 18.
This isn’t pessimism. It’s the same thing that happened in every platform cycle — SEO agencies in 2010, Facebook marketing in 2015, Shopify dropshipping in 2019. The tool access advantage is temporary. The relationship and knowledge moat is permanent.
“The tool access advantage lasts 12–24 months. The knowledge moat — built during that same window — can last a decade.”
The businesses I’m most confident about in 2026 are the ones building AI-powered services that generate proprietary data assets as a byproduct of delivery: benchmarking data, outcome datasets, process libraries, client pattern recognition. Not because they’re using better AI, but because they’ll be training systems on data that no one else has access to. That’s the moat that matters.
Your 90-Day Playbook
Concrete. Ordered. No hedging.
Days 1–7: Map & Score
List every repetitive task you or your team does. Score each on the RETI framework. Pick the top scorer. This is your first automation target. Subscribe to Claude Pro and Make.com (Core). Budget: under $50.
Days 8–21: Build the First Workflow
Design the workflow at Autonomy Level 2. Build it. Test it with real inputs. Document every output for the first two weeks. Fix every exception you find. Target: exception rate below 10%.
Days 22–35: Measure Ruthlessly
How many hours did you actually save? How much better were the outputs (use a quality rubric, not feelings)? What did it cost? Calculate your actual ROI. If it’s below 5×, the workflow isn’t right or the measurement is wrong. Fix one of them.
Days 36–60: Add Two More Workflows
Using the same process, build the second and third highest-scoring workflows from your RETI map. Begin connecting them — output from workflow 1 feeding workflow 2 where possible. This is when automation bridges matter.
Days 61–90: Move One Workflow to Level 3
Your best-performing, most reliable workflow should be promoted to Autonomy Level 3: AI executes, human monitors and handles exceptions. Set up monitoring alerts (Make.com has native error notifications). Establish a weekly review rhythm to catch drift.
Day 91: Stack Audit
Do a complete audit of your tool stack. What are you paying for that you’re not using? What capability gap is costing you time? Where did you hit the RETI score’s “Intelligence Required” ceiling that requires a different approach? This audit should take 3 hours and save you more than that every month going forward.
The One Thing You’ll Skip That You Shouldn’t
Building an AI policy before you build workflows. It sounds like corporate bureaucracy for a 2-person business. It isn’t. Your AI policy needs to answer four questions:
- Data boundary: What client data is allowed to be sent to which AI APIs, under which conditions?
- Review requirement: Which output types require human review before client delivery, always?
- Attribution standard: When do you disclose AI involvement to clients? (This matters legally in some sectors.)
- Model failure protocol: If your primary AI tool goes down, what’s the manual fallback? (Every tool goes down.)
A one-page document answering these four questions, signed off by every person on your team, prevents more problems than any sophistication in your automation stack.
For data policy guidance: SBA AI Business Resources and the Anthropic Privacy Policy (specifically the section on API data retention, which is materially different from the consumer app). For GDPR implications: European Data Protection Board guidelines on AI remain the clearest framework regardless of your jurisdiction.
A Final Word on Timing
The window where building an AI-powered small business gives you a meaningful head start over non-AI competitors is closing — but not as fast as the hype suggests. The SBA’s longitudinal analysis shows small businesses are only about a year behind large enterprises in AI adoption, which is unprecedented. But 8.8% are actually running AI in production. That means roughly 91 out of 100 of your competitors are in the same “experimenting with ChatGPT” phase — and probably half of those will plateau there indefinitely.
You have time to do this properly. Not infinite time, and not without urgency — but enough to build the right architecture rather than scrambling to bolt things together. The businesses that will define their niches over the next decade are the ones choosing, today, to build rather than just use.
The tools are there. The economics are the best they’ve ever been. The compounding advantage of going deep in the next 18 months is real and measurable. The only question is whether you’ll be in the 8.8% when the next measurement is taken.