

Every widely cited “AI agent failure rate” for 2026 — 95%, 89%, 88%, 86%, 80% — comes from a different study measuring a different question over a different time window. Only two of those numbers trace back to primary research with a disclosed methodology; the rest are secondhand compilations citing each other.
TL;DR
- MIT NANDA’s 95% figure and Gartner’s 40%-by-2027 forecast are the only two numbers in wide circulation with a named, disclosed methodology behind them — and they measure different things.
- Deloitte alone published three different 2026 production-adoption percentages (11%, 23%, 25%) from three different surveys, which is the cleanest proof that “the AI agent failure rate” isn’t one number.
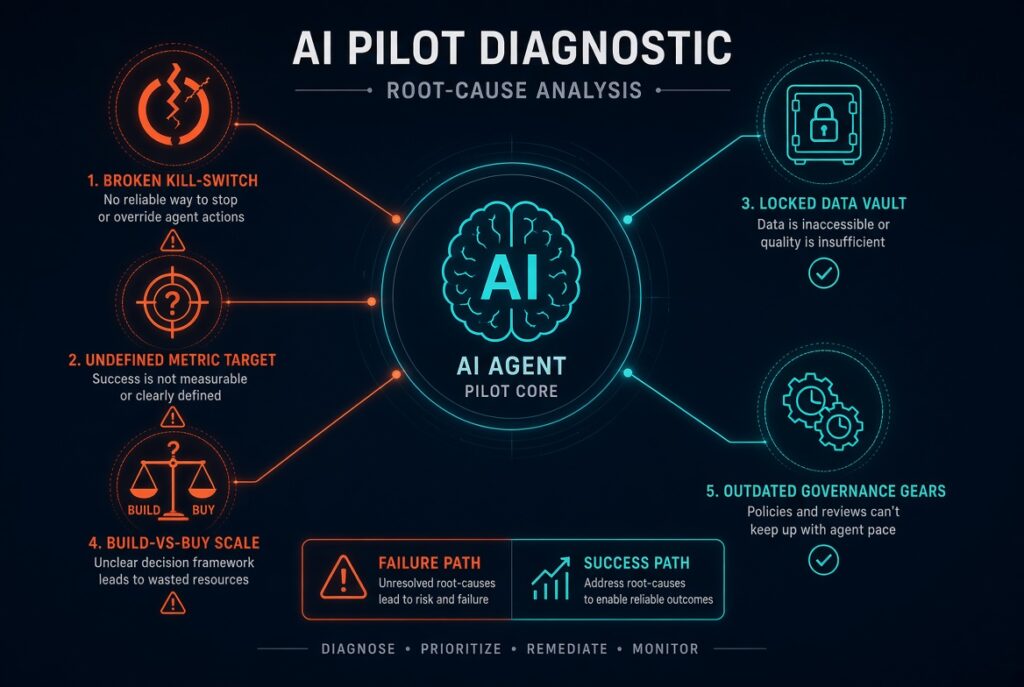
- Strip away the headline percentages and the root causes converge hard: unclear success criteria, missing data access, and no one with the authority to kill a bad pilot.
- A pilot that hasn’t shown a measurable signal by its category’s median payback window (3.4–8.9 months, depending on function) is very likely one of the ones that never ships.
- The failure rate for badly scoped pilots is going up as agent adoption accelerates faster than governance maturity; the failure rate for well-scoped, vendor-native deployments is trending down.
The Number Everyone Repeats and Nobody Sources
Open five different 2026 articles about AI agent adoption, and you’ll collect five different failure statistics, usually presented with the same tone of settled fact: 95% of pilots fail. No — 89%. No, actually it’s 88%, or maybe 86%, or a “twice the failure rate of normal IT projects” 80%. Writers cite these interchangeably, often in the same paragraph, as though they’re all restatements of one underlying truth.
They aren’t. They’re answers to different questions, asked of different populations, over different time horizons, by organizations with different incentives for the number to look the way it does. Untangling which number applies to which situation is not a pedantic exercise — it’s the difference between correctly diagnosing why your agent pilot is stuck and applying a statistic that has nothing to do with your situation.
This matters right now because 2026 is the year enterprise agent spending stopped being optional. Task-specific agents are shipping inside a majority of new enterprise applications, according to Gartner’s adoption tracking, and the budget conversation has shifted from “should we pilot this” to “why hasn’t this scaled yet.” Anyone trying to answer that second question with a borrowed statistic is going to reach for the wrong lever.
Seven Headline Numbers, Four Different Questions
Before assigning blame or building a framework, it helps to lay the actual claims side by side — what each one is really measuring, not just the percentage attached to it.
| Source | What it actually measures | Headline figure | Evidence type |
|---|---|---|---|
| MIT NANDA, The GenAI Divide (Jul 2025) | Share of enterprise GenAI pilots showing no measurable P&L return, from a review of 300+ public deployments plus interviews and a conference survey | 95% show no measurable return | Primary research |
| Gartner press release (Jun 2025) | Forecast share of agentic-specific projects that will be formally canceled by end of 2027, based on a Jan 2025 poll of 3,412 webinar attendees | 40%+ will be canceled by 2027 | Primary forecast |
| Deloitte, Tech Trends 2026 | Share of surveyed enterprises with agents already in production vs. still piloting | 11% in production, 38% piloting | Primary survey |
| Deloitte, State of AI in the Enterprise (Jan 2026, separate survey) | Share of respondents who have moved 40%+ of AI experiments into production | 25% cleared that bar | Primary survey |
| Teradata survey (via industry reporting) | Share of enterprises with an active pilot vs. one scaled organization-wide | 78% piloting, 14% scaled | Reported, single source |
| S&P Global Market Intelligence (via secondary reporting) | Share of AI proofs-of-concept scrapped before reaching production at all | 46% of PoCs scrapped | Reported, not independently verified against the primary document |
| RAND Corporation (via secondary reporting) | General AI project failure rate compared with conventional IT project failure rate | 80%+ fail, ~2x normal IT rate | Reported, not independently verified against the primary document |
The pattern that jumps out isn’t that these numbers contradict each other — it’s that almost none of them are measuring the same thing. MIT is measuring financial return, retrospectively, across GenAI broadly. Gartner is forecasting cancellations, specifically for agentic projects, over a future window that hasn’t closed yet. Deloitte and Teradata are measuring production status at a point in time, which is a completely different axis from “did it deliver value.” Treating any two of these as substitutable is where most of the circulating confusion starts.
The Cleanest Proof: One Vendor, Three Numbers, Same Year
If you want a single piece of evidence that “the AI agent failure rate” isn’t a coherent statistic, you don’t need to compare five different research firms. Deloitte alone published three materially different 2026 production-adoption figures, from three separate survey instruments, inside the same twelve months:
- Tech Trends 2026 reported 38% of organizations piloting agents and roughly 11% with agents already in production.
- A separate State of AI in the Enterprise release (January 2026) found only 25% of respondents had moved 40% or more of their AI experiments into production — a different threshold, a different question, a different sample.
- An April 2026 survey of 3,200+ leaders across 24 countries found 23% of companies already using agentic AI “at least moderately,” with 74% expecting to cross that bar within two years.
None of these numbers is wrong. They’re answering “how many organizations have agents in production,” “what share of pilots crossed a 40% conversion threshold,” and “how many companies report at-least-moderate agentic use” — three genuinely different survey questions that a content aggregator can flatten into one interchangeable “production rate” if nobody checks the underlying question wording. When one research organization can produce three different numbers for roughly the same underlying phenomenon, borrowing a rival firm’s number without reading its methodology is close to meaningless.
The Two Numbers With Real Primary Research Behind Them
Strip out everything compiled secondhand, and two data points remain standing on their own methodology.
MIT NANDA’s 95%. Published in July 2025 as The GenAI Divide: State of AI in Business 2025, the report reviewed more than 300 publicly disclosed AI initiatives, ran 52 structured interviews, and collected 153 survey responses from senior leaders at industry conferences. Its headline finding: just 5% of pilots were extracting measurable financial value, while the remaining 95% showed no measurable profit-and-loss impact. The report also found a sharp split by delivery model — pilots built on externally sourced tools succeeded roughly two-thirds of the time, versus roughly one-third for internally built systems.
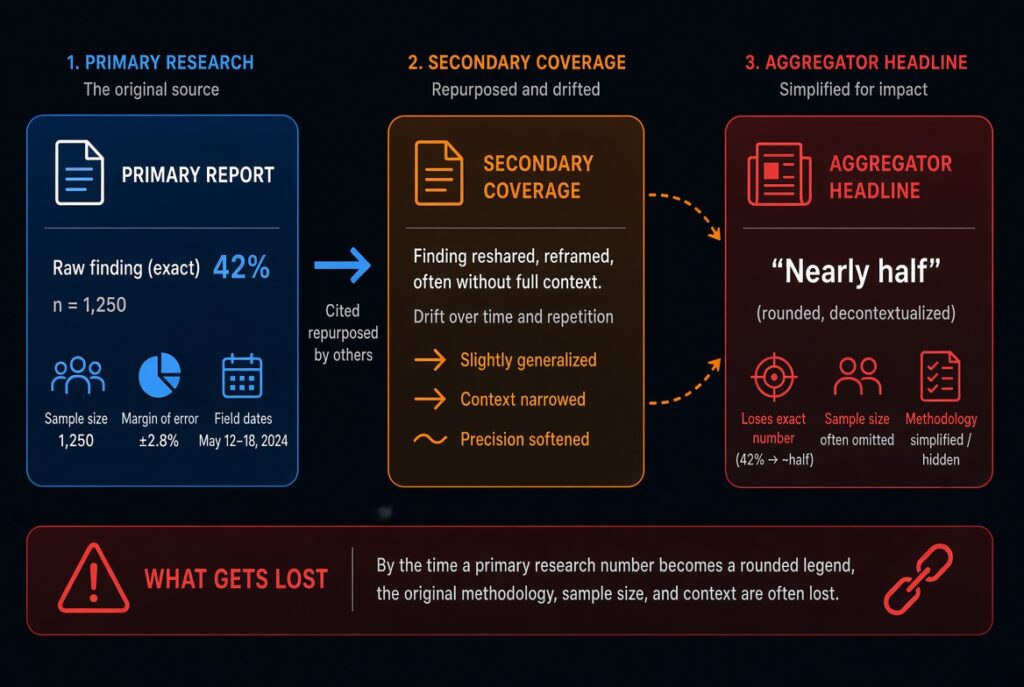
Here’s the catch, and it’s worth sitting with: multiple outlets covering this same report describe its methodology differently. Some cite “52 interviews and 153 survey responses,” matching the report’s own stated design. Others describe “150 interviews” and “a 350-employee survey” — a materially different sample. Both descriptions are attached to the same 95% headline number, in articles published within weeks of each other. That’s not two different studies disagreeing; it’s the same study’s methodology getting rounded and reshuffled as it passes through secondary coverage, while the one number everyone remembers — 95% — survives the trip unchanged because it’s the only part anyone quotes.
Gartner’s 40% by 2027. Published as a June 2025 press release, this is explicitly a forecast, not a measurement of something that has already happened. Gartner analyst Anushree Verma attributed the coming cancellations to escalating costs, unclear business value, and inadequate risk controls — not model capability. The forecast rests on a January 2025 poll of 3,412 webinar attendees, in which only 19% reported significant agentic AI investment and 42% called their investment conservative. Gartner also estimated that of the thousands of vendors marketing “agentic AI” products, only about 130 were building something that met the bar — the rest were repackaging existing chatbots or robotic process automation under a trendier label, a practice the firm calls “agent washing.”
A July 2026 Forbes analysis makes an important point that most recirculated coverage skips: it explicitly frames itself as revisiting a year-old prediction rather than reporting new data, because by mid-2026 most outlets had stopped mentioning that the 40% figure is a forecast for a window that runs through 2027 — not a rate that has already been observed. Citing it as a present-tense failure rate, as much 2026 coverage does, misstates what the number is.
What Every Study Agrees On, Once You Ignore the Headline
The genuinely useful finding buried under the percentage wars is that the root causes converge almost perfectly across every methodology, population, and research firm listed above — which is a much stronger signal than any of them individually, because independent surveys arriving at the same mechanism rarely do so by coincidence.
Across MIT NANDA, Gartner, Deloitte’s multiple survey waves, and the Forrester-sourced root-cause breakdowns circulating in 2026 industry reporting, the recurring blockers are:
- No one owns the kill decision. Pilots that should have been shut down at month three run for a year because no single person has the authority — or the incentive — to end them.
- Success criteria were never defined before launch. A pilot without a pre-agreed metric can’t fail, technically, because it also can’t succeed. It just continues.
- The agent can’t reach the data it needs. Legacy systems, permission walls, and non-searchable data stores block the agent from the context required to act reliably — Deloitte’s Tech Trends 2026 names this directly as a structural obstacle, not a training problem.
- Build-versus-buy was decided on ideology, not evidence. MIT NANDA’s two-thirds-versus-one-third success gap between externally sourced and internally built pilots is one of the largest effect sizes in any of this research, and it rarely gets mentioned alongside the failure-rate headline it belongs next to.
- Governance was designed for software, not for autonomous decisions. Existing IT approval processes don’t have a mechanism for an agent that can act on its own between review cycles.
None of these five causes appears on a single vendor’s marketing slide, because none of them is solved by a better model. That’s precisely why they show up consistently across studies that otherwise can’t agree on a shared percentage.
A Diagnostic Table for the Pilot You’re Actually Running
If you’re trying to figure out which failure mode applies to your own pilot rather than which statistic to quote in a deck, match the symptom to the cause:
| Symptom you’re seeing | Likely root cause | Where this shows up in the research |
|---|---|---|
| The pilot has run for two+ quarters with no clear verdict | No owner has authority to kill or scale it | Deloitte governance findings; Gartner’s “escalating costs, unclear value” framing |
| Demo works, production keeps slipping | Agent lacks reliable access to live, structured data | Deloitte Tech Trends 2026’s “data architecture constraints” |
| Leadership keeps asking “is this working” and nobody can answer cleanly | No metric was set before the pilot started | Forrester’s root-cause split attributes roughly 41% of negative-ROI cases to unclear success criteria |
| Internal build has stalled twice as long as a vendor pilot in the same category | Build-vs-buy mismatch for this use case | MIT NANDA’s two-thirds vs. one-third success split |
| The vendor’s product looks identical to last year’s chatbot with a new label | Possible agent washing | Gartner’s ~130-real-vendors estimate |
The Uncomfortable Math on a Pilot That Won’t Die
Median time-to-value across enterprise agent deployments sits around 5.1 months, according to combined BCG and Forrester 2026 survey data — with sales-development agents paying back closer to 3.4 months and finance or operations agents closer to 8.9 months, reflecting how much integration and review those categories typically require before an agent can act unsupervised. Treat these as directional benchmarks from a compiled industry source rather than an audited figure specific to your organization.
Even so, they’re useful as a tripwire. If a customer-support or sales-development pilot has run past its median 3.4-month payback window with no measurable signal, the base rate says it’s more likely to belong in the 88–95% cohort that never converts than in the successful minority — not because the window is a hard deadline, but because a pilot with a defined success metric and working data access tends to show some directional signal well before that point. A finance or operations pilot deserves more patience, given its longer typical runway, but the same logic applies once you’re two to three months past its category’s median.
The practical rule this suggests: set the review date before the pilot launches, tied to your category’s realistic payback window, not to whenever the sponsoring executive next asks for an update. Every root cause listed above — no owner, no metric, no data access — becomes far easier to diagnose against a calendar date than against a vague sense that “it’s taking a while.”
Will This Get Better or Worse From Here
Both, on different tracks, and the direction depends entirely on which cohort you’re asking about.
The raw volume of poorly scoped pilots is very likely to keep the aggregate failure numbers high through 2026 and into 2027, simply because agent adoption is accelerating faster than governance maturity can follow. Gartner’s own adoption tracking shows the share of enterprise applications embedding an agent climbing sharply year over year, which mechanically increases the pool of new, unproven, often unscoped projects entering the denominator of any failure statistic measured at a point in time. More pilots launched under time pressure means more pilots that skip the success-criteria and data-access work MIT and Deloitte both flag as decisive.
Inside that aggregate number, though, the well-scoped subset is trending in the opposite direction. MIT’s two-thirds success rate for externally sourced pilots versus one-third for internally built ones is a strong, mechanism-based reason to expect the vendor-native, narrowly scoped, clearly owned category of agent deployment to keep improving — because it’s solving the actual problems the research identifies (data access, defined criteria, accountable ownership) by construction, not by hoping the next model release fixes them. Gartner’s own reasoning points the same way: the firm attributes coming cancellations to cost, value clarity, and risk controls, not to the models running out of capability. That’s a forecast about organizational discipline catching up, not about the technology plateauing.
The practical implication: don’t wait for “the industry” failure rate to drop before trusting your own pilot. Watch whether your project has the three things every study agrees on — an owner who can kill it, a metric defined before launch, and real data access — and treat those as the leading indicators the aggregate statistics can’t give you.
Next Step
Before greenlighting the next agent pilot, or deciding whether to keep funding the one already running, run it against the diagnostic table above rather than against whichever failure-rate headline showed up in your feed this week. If you can’t answer who owns the kill decision, what the pre-defined success metric is, and whether the agent has real access to the data it needs, you already know more about your pilot’s odds than any industry-wide percentage could tell you.