

AI ROI Is Not
What You Think —
Here’s What the Data Shows
The gap between AI spending and AI proof is the defining tension of 2026. Most companies are measuring the wrong things, celebrating the wrong wins, and quietly absorbing the wrong costs. Here’s what the real evidence says — and what it means for your decisions.
The Uncomfortable Summary
- 95% of AI pilots deliver zero measurable P&L impact (MIT, 2025)
- Only 5% of enterprises with AI programs achieve what IBM calls “substantial ROI”
- The gap is almost never about the model — it’s about measurement, workflow design, and data readiness
- Companies measuring “hours saved” are measuring activity, not value
- The 5% who win have three things the rest don’t: baselines before deployment, redesigned workflows, and 60–90 day proof windows
Should You Even Chase AI ROI Right Now?
Before you invest another dollar in measurement frameworks, pilots, or consulting engagements, answer this honestly. Your current position determines whether pursuing formal AI ROI measurement will pay off — or whether it will generate more dashboard theater.
| Your Situation | Recommendation | Why |
|---|---|---|
| No baseline metrics on any process you’re deploying AI into | Stop. Baseline first. | Without a pre-AI benchmark, any improvement number you report is fiction |
| Running 3+ AI pilots simultaneously with no production deployments | Kill at least two pilots. | High performers ruthlessly kill 46% of POCs before production. Spreading thin is a value destruction strategy |
| AI deployed in production, measuring adoption rate, but not business outcomes | Change what you measure. | Adoption rate is an activity metric. It tells you usage, not value |
| Clear baseline, single high-priority use case, defined outcome metric | Proceed. You’re set up to win. | You have the structural conditions that separate the 5% from the rest |
| No CFO/CTO alignment on how AI success will be measured | Align before deploying. | 65% of organizations lack this alignment (Kyndryl). Without it, every AI initiative becomes a political battleground |
The Actual Problem: You’re Measuring the Wrong Thing
Here’s what a typical enterprise AI measurement stack looks like in 2026: number of active users, queries per week, hours saved (self-reported), and demo screenshots that impressed the board. What it rarely includes: a documented pre-AI baseline for the process being automated, a control group or comparable period, and any connection between “hours saved” and headcount reduction, revenue increase, or error rate improvement.
This isn’t an accident. It reflects a structural incentive problem that runs through the entire vendor ecosystem. Vendors get paid for adoption and seat expansion. Enterprises get measured on outcomes. That misalignment shapes every ROI calculator, every “time-to-value” promise, and every pilot result that gets presented to leadership.
“Too many leaders measure the ROI of AI through the lens of cost savings. AI’s impact rarely shows up first as efficiency — it shows up in greater insight, more predictive power, and the ability to evaluate more scenarios before acting.”
Microsoft’s own transformation team identified this pattern across industries. The problem isn’t that AI doesn’t create value — it clearly does, particularly at the task and team level. The problem is that organizations are using metrics designed for cost-reduction projects to evaluate a technology that primarily delivers capability expansion. That’s a category error, and it’s causing real investment decisions to go wrong.
The Measurement Mismatch: GenAI users save roughly 5–6% of weekly work hours on average. Yet aggregate productivity impact remains near zero at the macro level, because most of those gains are absorbed by rework, substitution, or non-economic use of recaptured time. Task-level speed gains of 14–55% are common — but 37–40% of time saved goes straight back into fixing low-quality AI output (Workday, 2026).
What the Cross-Study Data Actually Shows
The data creates an uncomfortable tension. On one side, vendors publish case studies showing 333% ROI and six-month payback periods. On the other, independent cross-industry research consistently finds that the vast majority of AI programs produce no measurable financial return. Both things can be true — because the distribution is radically uneven.
The companies publishing exceptional ROI results are, by definition, not representative. They are the 5% who had the structural conditions to win before they deployed. The other 95% are largely absent from vendor case studies — but present in Morgan Stanley reports, MIT research, and CFO conversations behind closed doors.
The Distribution Problem: Cross-industry AI ROI data shows a 1.7× average for leaders — but 30% of executives who can quantify ROI at all report returns under 5%. The average is being pulled up by a small number of very high performers. Median ROI sits around 10%, well below the cost of capital for many programs (BCG, IBM, Capgemini).
The financial markets have already noticed. Citi identified a 30 basis point credit spread penalty for companies classified as AI “adopters” versus “enablers” — meaning debt markets are now pricing a premium for spending without evidence of return. The gap between measuring activity and measuring proof is now priced into the cost of capital. This is not a soft reputational risk. It’s a hard financial one.
The Three-Layer Framework That Separates Winners from the Rest
Layer 1 — Task-Level AI: Individual tasks automated or accelerated. Most companies stop here. This is where the 5–6% time savings live — real, but not compoundable without the layers above.
Layer 2 — Automation-Level AI: Tasks connected into workflows. AI outputs feed downstream systems. This is where productivity gains start converting into measurable throughput increases rather than individual efficiency anecdotes.
Layer 3 — Decisioning-Level AI: AI informs or makes operational decisions, creating feedback loops that improve over time. This is where the 1.7× revenue growth, 3.6× TSR, and 2.7× return on invested capital numbers that BCG’s “visionary” companies report come from.
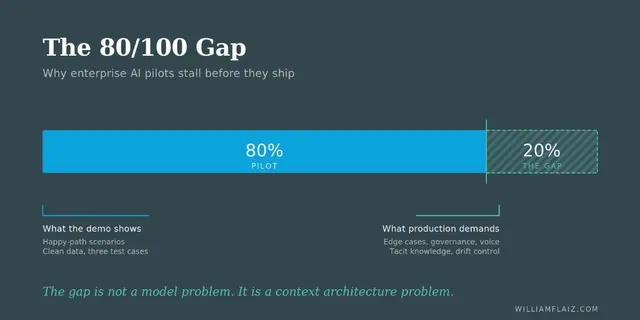
Key constraint: 80% of the work required to move from pilot to Layer 3 is data engineering, governance, workflow integration, and measurement infrastructure — not model selection (Terminal X / MIT synthesis).
Most organizations build Layer 1 and declare success. The layer-to-layer progression requires organizational capabilities — baseline measurement, data discipline, governance, and workflow redesign — that take months to build and cannot be purchased off the shelf. This is why companies with higher overall AI investment don’t automatically see higher ROI: investment without infrastructure is waste.
What High Performers Actually Do Differently
| Practice | High Performers | Everyone Else |
|---|---|---|
| Baselines | Documented before deployment | Estimated retroactively, if at all |
| Proof window | 60–90 days or kill the initiative | Pilots running 12+ months without production |
| Workflow approach | Redesigned from scratch (3× more likely, McKinsey) | AI layered on top of existing broken process |
| POC survival rate | Ruthlessly kill 46%+ before production | Keep everything running “just in case” |
| Governance | Precedes deployment | Reactive, added after problems emerge |
| Measurement metric | Business outcomes (revenue, error rate, throughput) | Activity metrics (queries, adoption rate, “hours saved”) |
How AI ROI Actually Works Together: A Real Workflow
Abstract frameworks don’t help if you can’t see how the pieces connect in practice. Here’s how a company moving from zero to measurable ROI actually sequences the work — and where the common integration failures occur.
Baseline Documentation (Week 1–2)
Measure the current state of the target process: cost per transaction, error rate, cycle time, headcount involved. Do this before any AI touches the workflow. Without this number, every future claim is unverifiable.
Use Case Prioritization (Week 2–3)
Score potential AI applications by: baseline clarity (can we measure it?), impact potential, and data readiness. Kill any use case that fails two of the three. This is where most organizations refuse to be ruthless — and pay for it later.
Workflow Redesign (Week 3–6)
Redesign the process from scratch around AI capabilities — not around the existing process with AI bolted on. McKinsey identifies this as the single highest-ROI predictor. High performers are 3× more likely to have rebuilt processes from the ground up.
Constrained Deployment (Week 6–10)
Deploy to a defined user group or process volume. Not a demo environment — actual production. Measure against the baseline from Step 1. Connect tool outputs to downstream systems where possible (this is the Layer 2 transition).
60-Day Proof Gate
At 60 days: does the measurable outcome metric show improvement against baseline? If yes, expand. If no, diagnose before expanding. The discipline to hold this gate is what separates programs that scale from those that drift into “strategic investment” language indefinitely.
Scale and Compound (Month 3+)
Connect validated workflows across functions. Introduce agents where human-in-the-loop approval can be safely reduced. Agentic AI currently accounts for 17% of total AI payoff and is expected to reach 29% by 2028 — this is where the compounding starts.
Integration Friction Points to Expect: Data quality issues surface in Step 3–4, typically 2–3× more severe than anticipated. Legacy system APIs create unexpected latency in the workflow. Governance review cycles add 2–4 weeks that weren’t in the project plan. Employee behavior change is slower than adoption metrics suggest — measuring login rates isn’t measuring changed behavior.
The 80% Solution Stack
In many enterprise workflows, a focused three-component stack captures the majority of available ROI without the complexity overhead of a sprawling toolchain. The principle: each component has a clear, measurable function, and they’re connected — not running in parallel silos.
Use this framework to evaluate tools, not the reverse. The specific vendor choices matter far less than whether these three layers exist and are connected. Toolchain sprawl — accumulating AI tools without connecting them — is itself a major source of ROI destruction.
Note: Stack composition and vendor options evolve rapidly. Validate current offerings against your data environment before committing. Last reviewed: May 2026.
Limitations and What This Data Can’t Tell You
The cross-study data cited in this article is real, but it comes with constraints that matter for how you apply it.
Survivorship bias in positive case studies. Vendor-published ROI results — including those showing 300%+ returns — are drawn from the customer segment that agreed to participate in case studies. In many workflows, that’s the customer who succeeded. The median customer experience is systematically underrepresented.
Industry and function variation is large. Supply chain, finance operations, and customer service show the clearest and most measurable ROI across the literature. Knowledge work — strategy, product development, creative functions — shows real task-level gains but much weaker business-level impact. The aggregate statistics blend these very different situations.
Time horizon matters enormously. As UC Berkeley’s SCET research argues, demanding immediate ROI from AI may be the wrong frame entirely. The internet didn’t show clear financial returns in its first four years of enterprise adoption. Some AI investments are building capabilities that will compound over years — and forcing quarterly ROI measurement on them will lead to premature cuts of the wrong programs. The challenge is distinguishing genuinely long-horizon investments from initiatives using “strategic value” as cover for poor execution.
What the data does tell you reliably: The structural conditions for AI ROI are knowable and repeatable. Workflow redesign before deployment, documented baselines, 60–90 day proof windows, and governance-before-scale consistently separate high performers from the rest — across industries, geographies, and model types. These aren’t model-specific advantages. They’re organizational ones.
FAQ
Not quite — but the pilot structure needs to change. Most pilots fail not because piloting is wrong, but because they run too long in controlled environments without production constraints. The winning approach is treating pilots as 60-day production-scale tests with predetermined decision criteria: if the outcome metric moves by X within 60 days, we scale. If not, we kill it. The problem isn’t the pilot — it’s the indefinite pilot.
Vendor ROI calculators have a structural problem: they’re designed to justify purchase decisions, not to predict your actual returns. The most common failure is treating “hours saved” as equivalent to “money saved” — which requires an assumption that saved hours translate into headcount reduction or revenue-generating activity, neither of which is automatic. Use vendor calculators as a ceiling estimate, then discount heavily based on your data readiness, workflow redesign capacity, and change management maturity.
This is the most common AI ROI failure pattern in 2026. Individual gains — faster drafting, quicker research, improved code completion — are real, but they don’t automatically aggregate to organizational outcomes. The gap between personal efficiency and business value is the workflow layer: whether individual time savings are being redirected to higher-value work, connected to downstream processes, or simply absorbed by rework and non-economic activity. The fix is workflow redesign, not better models.
For well-structured programs in high-fit use cases (supply chain, finance operations, customer service), 40% of organizations expect positive yields within 1–3 years and 35% within 3–5 years. For programs in knowledge work functions with weaker baselines, 3–5 years is a more realistic horizon. Programs that can’t show any directional evidence within 90 days of production deployment should be restructured or killed — “strategic value” language without measurement is almost always a warning sign, not a feature.
Final Thought
The honest version of the AI ROI conversation in 2026 is uncomfortable for almost everyone at the table. For technology vendors, because it exposes the gap between adoption metrics and financial outcomes. For executives, because it requires admitting that most AI investment has not yet proven its return. For the 5% of companies who are winning, because their advantage isn’t technological — it’s organizational discipline that most of their competitors could replicate if they were willing to do the hard, unglamorous work first.
The data points toward a simple but difficult conclusion: AI strategy is not primarily a technology problem. It’s a measurement problem, a workflow design problem, and a change management problem that happens to use technology as its instrument. Organizations that understand this distinction are building the capability layers that will compound over the next five years. Those that don’t are running expensive experiments while calling them transformations.
The question worth sitting with is this: if your CFO asked tomorrow — “What changed in dollars?” — could you answer it? Not with a demo, not with an adoption curve, not with a vendor case study. With a documented baseline, a measured outcome, and an honest attribution. If the answer is no, that’s the only AI problem worth solving right now.
You can have AI that impresses in demos, or AI that proves its value in production. The organizational structures required for each are almost entirely different. Most companies have built for demos. The 5% built for proof — and they did it before the models were nearly as capable as they are today.
Primary Sources
- [1]MIT NANDA Initiative — “The GenAI Divide: State of AI in Business 2025.” Foundational study showing 95% of pilots delivering zero P&L impact. Referenced via Terminal X analysis
- [2]IBM Research — Enterprise AI Report, February 2026. “Substantial ROI” benchmark and 5% organization finding. Referenced via AI Magicx
- [3]Deloitte — “State of AI in the Enterprise 2026: The Untapped Edge.” Production deployment gap and governance analysis. Via Fortune coverage
Secondary Sources
- [4]BCG — AI Value Capture research, 2025–2026. Visionary company multipliers (1.7× revenue growth, 3.6× TSR). Via Master of Code synthesis
- [5]McKinsey — Workflow redesign as top predictor of AI value capture. High performer process reconstruction data. Via Svitla analysis
- [6]UC Berkeley SCET — “Beyond ROI: Are We Using the Wrong Metric in Measuring AI Success?” February 2026. Direct source
Related on Trendix
Last reviewed: May 2026 · Next review scheduled: August 2026 · Statistics and benchmarks are drawn from cross-industry research published between Q3 2025 and May 2026. Enterprise AI ROI data evolves rapidly; verify key figures against primary sources before using in business cases.
The AI Governance Checklist Companies Are Using to Stay Safe
AI Agent Use Cases by Business Function:The 2026 Prioritization Guide
AI Customer Service Tools Ranked: Chatbots, Live Chat & Hybrid Solutions
AI Agents & Multi-Agent Systems: Everything Changes This Year
AI Industry Applications: The Definitive 2026 Field Guide
The Voice & Video AI Revolution:Everything That Matters in 2026
Perplexity Comet & the AI Personal Computer: Everything Explained
AI Research Paper Writing: Complete Guide From Outline to Submission
AI-Generated Code Is Riskier Than You Think — Here’s Why