

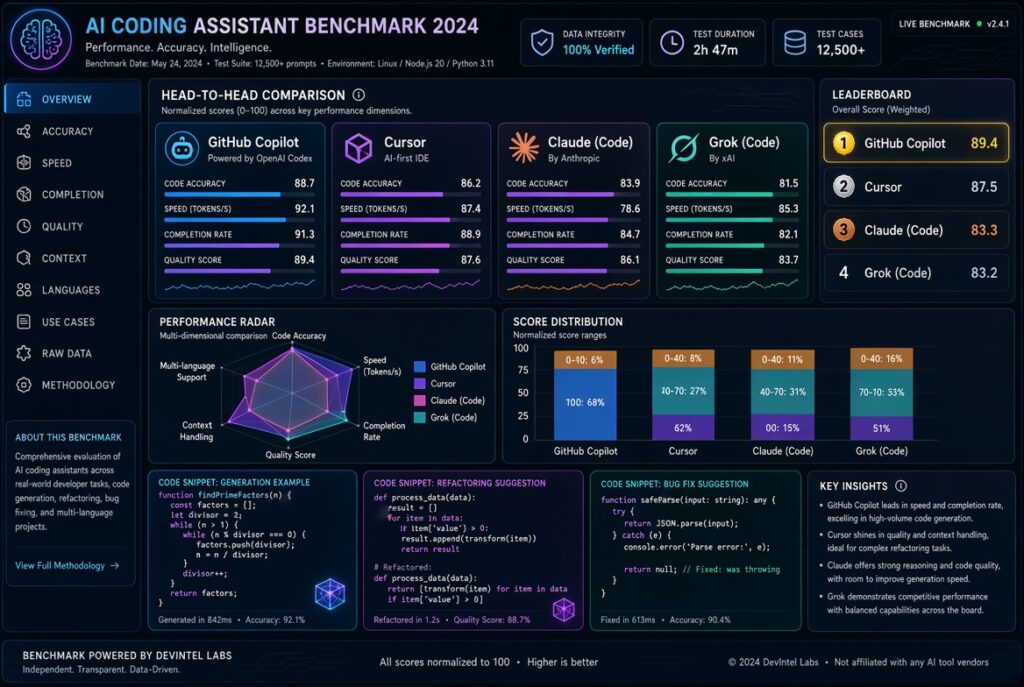
Direct answer: No public benchmark currently ranks AI coding assistants reliably on speed, accuracy, and cost together. Accuracy scores depend on who ran the test and on the tool wrapped around the model. Speed is barely measured outside one dated randomized trial. Cost is set by billing model and retry rate more than by seat price. Choose with a replay test on your own repository (method below), not with a leaderboard.
By Tom Morgan. Research-assisted with AI, using published sources only. I ran no benchmark of my own for this piece, and every number below is attributed to whoever produced it. Pricing and scores were checked October 15, 2026.
One model, the same benchmark, and two numbers 28 points apart. Anthropic’s system card puts Claude Opus 5.5 at 89.9% on SWE-bench Pro, and the October 2026 BenchLM leaderboard repeats it. The standardized table on Scale AI’s own leaderboard, as I retrieved it, tops out at 61.5% (±3.1) for Meta’s Muse Spark 1.1.
Part of that gap is vintage: Scale’s table lists older Claude models, and I found no Scale run of the 5-series. Part is who ran it, and part is the harness. I can’t tell you the split, and neither can any site that puts these two columns side by side.
That is the article. A coding benchmark score describes three things at once: the model, the scaffolding that drives it, and the task set. Most “benchmarked” comparisons swap one for another without saying so.
Accuracy: rank the evidence before you read the score
The table lists reported SWE-bench Pro numbers, with the runner stated, since that matters more than the digit.
| Model | SWE-bench Pro | Who produced it | How much to trust it for comparison |
|---|---|---|---|
| Claude Opus 5.5 | 89.9% | Anthropic system card, relayed by CodingFleet | Vendor-run; not standardized |
| Claude Sonnet 5.5 | 81.3% | Same | Vendor-run |
| Claude Fable 5.1 | 81.2% | Same | Vendor-run |
| GPT-5.6 Sol | 64.6% | Vendor-reported, relayed by Morph | Vendor-run, secondary relay |
| Muse Spark 1.1 | 61.5 ± 3.1 | Scale AI, same scaffold for all | Standardized, but older model set |
| GPT-5.4 (xHigh) | 59.1 ± 3.6 | Scale AI | Standardized |
| Claude Opus 4.6 (thinking) | 51.9 ± 3.6 | Scale AI | Standardized |
You cannot read this table top to bottom as a ranking. The rows above the line come from each lab’s own evaluation setup. The rows below come from one shared setup. Different columns, different measurements.
The task set has its own problem. On July 8, 2026, OpenAI published an audit of the 731-task public split and retracted its earlier recommendation of the benchmark. Its automated pipeline flagged 200 tasks (27.4%) as broken, and human annotators flagged 249 (34.1%). The defects it lists are over-strict hidden tests, underspecified prompts, and low-coverage tests. Two caveats apply. I read this through secondary coverage, not OpenAI’s post. And OpenAI competes with the labs whose scores it is questioning, so the audit deserves scrutiny too. Still, a roughly 30% defect rate can’t be dismissed. With it, a failed task can mean a bad test rather than a bad agent.
One more secondary claim, which I can’t verify: a Verdent explainer says that on the same tasks, changing the turn limit moved scores almost threefold. If that is even partly right, the harness setting swamps the differences between models near the top.
My judgment: treat any single-digit gap on SWE-bench Pro between assistants as noise. Treat a vendor-run figure as a statement about that vendor’s setup. Use the leaderboard only for coarse tiers, such as “frontier versus last year’s model.”
Speed: the least measured of the three
I found no credible public benchmark of wall-clock time to a reviewed, merged change across Copilot, Cursor, Claude Code, and Codex. What exists is indirect.
Agent-level scores. Terminal-Bench measures how well a model-plus-agent pair completes command-line tasks. The Morph leaderboard reports Claude Code with Opus 5 at 53.9% on Terminal-Bench 4.0 and with Fable 5.1 at 57.9%, against 52.3% for Opus 5 reported at model level. Those are completion rates, not speed, and the sources mix vendor and third-party runs.
The one randomized trial. METR’s 2025 study had 16 experienced open-source developers complete 246 real tasks in repositories they knew well. With AI allowed, they took 19% longer, yet afterward estimated AI had made them about 20% faster. That is a 39-point gap between feeling and measurement.
Don’t stretch it. The trial covered early-2025 tools, and METR now labels the result historical. Its February 2026 follow-up reported some evidence of speedup but said selection effects, with developers refusing to work without AI, made the central estimate unreliable.
What I conclude: the finding that survives is about perception, not about any tool. Developers misjudge their own speed by a wide margin, so a team’s “it feels much faster” is the weakest evidence on this page. If speed matters to your purchase, measure it.
Cost: the seat price is the smallest part
List prices as tracked by Developers Digest, verified September 28, 2026. I did not open each vendor’s pricing page, so confirm before buying.
| Tool | Entry | Middle | Top | What actually limits you |
|---|---|---|---|---|
| GitHub Copilot | Pro $10 ($15 credits) | Pro+ $39 ($70 credits) | Max $100 ($200 credits) | Metered AI Credits at $0.01 each; completions unmetered on paid plans |
| Cursor | Pro $20 | Pro Plus $60 | Ultra $200 | Usage pool on top of the seat |
| Claude Code | Pro $20 ($17 annual) | Max 5x $100 | Max 20x $200 | Shared usage pool with capped overage |
| OpenAI Codex | Plus $20 | Pro from $100 | Pro up to $200 | Token-based credits since April 2026 |
Two details matter more than the sticker. Copilot moved to metered credits on June 1, 2026. Per CloudZero, its $19 Business seat now includes $19 of credits, down from a promotional $30, as of September 1, 2026. Heavy agent users burn through that quickly.
Anthropic’s published usage figures, relayed by OptimNow, put the average API-key Claude Code user at about $6 a day, with 90% under $12. At 22 working days (my assumption), that is:
- $6 × 22 = $132/month for the average API-key user
- $12 × 22 = $264/month at the 90th-percentile ceiling
Both exceed the $100 Max 5x plan, and the average also exceeds the cheapest Max tier by 32%. That is the honest case for flat plans among heavy users. It doesn’t prove a flat plan is cheaper for you, because the $6 average mixes light and heavy users.
For a ten-person team on monthly list pricing, Copilot Business is $19 × 10 × 12 = $2,280 a year. Cursor Teams Standard at $40 is $4,800. The gap is real but small beside one engineer’s loaded cost, which is why the next section matters more than the seat price.
The distinction that changes the buying decision
Everything above prices tokens, seats, or percentages. None of it prices a merged change.
An assistant that solves 80% of tasks but leaves a reviewer fifteen minutes of cleanup per task can cost more than one that solves 65% and arrives clean. Reviewer minutes are the highest cost, and no vendor reports them. So the metric to buy on is:
Cost per accepted change = (tool spend + reviewer minutes × loaded hourly rate ÷ 60) ÷ changes merged
Illustrative arithmetic, not data: say Tool A spends $40 over 20 merged changes and costs 12 reviewer minutes each. Tool B spends $90 over 20 merged changes at 4 minutes each. At a $90 loaded rate, A costs ($40 + $360) ÷ 20 = $20.00 per change, and B costs ($90 + $120) ÷ 20 = $10.50. The “cheaper” tool is nearly twice as expensive. The numbers are invented to show the mechanism. Yours will differ.
The replay test
- Pull 30 closed tickets from your own repository, ones where the merged diff is your ground truth. Exclude any that depend on private context nobody wrote down.
- Give each assistant the same ticket text, the same starting commit, and the same time limit.
- Record first-attempt test pass, reviewer minutes to an acceptable diff, and total spend.
- Repeat each ticket at least three times, since agent runs vary. Report the spread, not the best run.
- Compute the formula above per tool. Discard any tool whose spread is wider than the gap between it and the winner.
If two tools land within noise, pick the cheaper seat and the one your editor already supports. Thirty tickets won’t give you statistical significance; they give you a decision that beats a leaderboard.
What this means for workflow
- Mostly completions and small edits: Copilot Pro at $10 is the rational floor, and benchmark rank barely applies to its core use.
- Delegating whole tasks: start on a $20 plan, run the replay test, and only buy a $100+ tier after your own usage logs show you hitting limits. Anthropic’s average API-key figure above is a reason to check, not proof you need it.
- Teams: seat overlap is the quiet leak. Per OptimNow, developers paying for two billing streams (a Cursor seat plus a Claude Max plan, say) is common, and nobody compares them.
- Anyone citing a SWE-bench Pro figure in a procurement memo: ask who ran it, with which harness, and whether it predates the July audit.
The question this evidence can’t answer
Does a higher SWE-bench Pro score predict more merged pull requests, fewer review cycles, or lower cost per accepted change? Nothing I found tests that. The benchmark measures hidden-test pass rates on curated tasks, and the audit suggests roughly a third of those tests misjudge the outcome. Resolving it would take a METR-style randomized trial with current tools, measuring review-accepted merges instead of completion time, on repositories the participants know. Until that exists, any claim that benchmark rank translates into team productivity is a hypothesis.